CART

A turtle diagram is the one-page picture of a process that automotive auditors expect
to see, and one of the few quality tools that earns its keep in the room rather than in the filing
system. It is worth being clear from the start about something suppliers are rarely told: IATF 16949
does not require a turtle diagram anywhere. It requires the process approach. The turtle diagram is
simply the technique the industry converged on for demonstrating it.
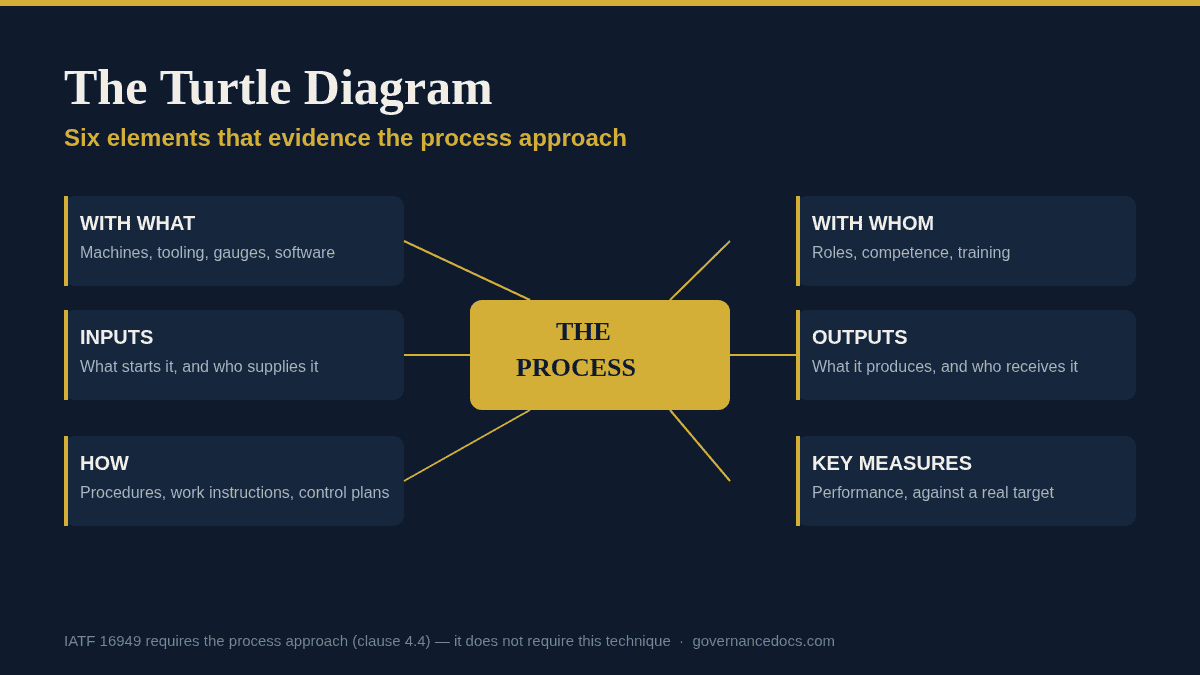
The name comes from the shape. The process sits in the middle as the body. Inputs enter from the
left and outputs leave to the right. Four legs hang off the body, each answering one question about
how the process is resourced and controlled:
| Element | The question it answers |
|---|---|
| Inputs | What starts this process, and who supplies it? |
| Outputs | What does it produce, and who receives it? |
| With what | Which machines, tooling, gauges and software are used? |
| With whom | Which roles, what competence, what training? |
| How | Which procedures, work instructions and control plans govern it? |
| Key measures | How do you know it is performing, and against what target? |
That is the whole technique. Its power is that the six boxes are unforgiving: a process owner who
cannot name the competence requirement or the performance measure has just discovered a real gap, on
one page, in front of everybody.
ISO 9001 and IATF 16949 are built on the process approach — the idea that a management system
is a set of interacting processes with defined inputs, outputs, resources and measures, rather than a
set of clauses with documents attached. Clause 4.4 is where that expectation lives.
The difficulty is that the process approach is a way of thinking, and auditors have to audit
something. A turtle diagram converts the thinking into an artefact. When an auditor selects your
heat treatment process, the turtle diagram tells them in thirty seconds who owns it, what governs it,
what it is measured on and where to go next for evidence — and it tells them whether the
organisation has genuinely thought about the process or has simply written procedures.
This is also why the turtle diagram survives standards revisions. Documentation organised by clause
number has to be rebuilt when clauses renumber. Documentation organised by process does not.
Experienced auditors use it as an interview script, and you should too. Internal
audits run process by process rather than clause by clause find far more than clause-driven audits,
because they follow the same trail an external auditor will. Take the six legs in order and ask for
evidence of each. Anywhere the process owner hesitates is where the external audit will land.
33 turtle diagrams, already mapped to real processes.
The IATF 16949 Toolkit ships 250+ editable MS Office templates built around the process approach — turtle diagrams for production, maintenance, calibration, purchasing, design, internal audit, dispatch and more, alongside APQP and PPAP packs, the process flow / FMEA / control plan workbook and MSA and SPC calculators.
Abstract descriptions of the technique are easy to agree with and hard to apply. Here is what the
six elements look like filled in for a single real process, at the level of specificity that survives
an audit.
| Element | Filled in |
|---|---|
| Inputs | Delivered material and its certificates; the purchase order; the approved supplier list; the inspection standard for the part |
| Outputs | Released stock; quarantined nonconforming material; inspection records; supplier performance data |
| With what | Named gauges with asset numbers; the ERP goods-in module; the quarantine area |
| With whom | Receiving inspector, with the competence requirement and the training record that evidences it |
| How | The receiving inspection procedure and the nonconforming material procedure, by document number and revision |
| Key measures | Supplier PPM against target; inspection lead time against target; escaped defects, target zero |
Notice how much of the audit is now pre-answered. The gauge asset numbers lead straight to
calibration records. The competence requirement leads to training records. The measures lead to the
management review. An auditor following that trail is working through your evidence rather than
hunting for it, and the whole session is shorter as a result.
A SIPOC captures suppliers, inputs, process, outputs and customers — the flow across the
boundary. A process map or flowchart captures the sequence of steps inside. This technique captures the
resourcing and control of the process as a whole: what it runs on, who runs it, what governs it and how
you know it is working. The three answer different questions and a mature system carries all three, but
only one of them is designed to be read in the audit room.
If you already maintain detailed flowcharts, do not replace them. Add the six-element view on top,
one page per process, and use the “how” leg to point at the flowchart.
The failure mode for this technique is not building the diagrams badly. It is building them well,
once, and letting the site drift away from them. Two mechanisms keep the set honest without creating a
maintenance burden.
First, tie the review to something that already happens. Every process has a management review input
and an internal audit slot; make confirming the six elements part of both, so review is triggered by
the calendar rather than by good intentions. Second, make the process owner sign the annual
confirmation. A signature against an out-of-date description is uncomfortable in a way that a silent
document is not, and that discomfort is what produces updates.
A set that is reviewed annually and revised on change is worth more than a larger, prettier set
produced for a certification audit two years ago and untouched since.
Is a turtle diagram required by IATF 16949?
No. The standard requires the process approach and does not name any particular technique. The turtle
diagram is the industry’s conventional way of evidencing it, and auditors are used to seeing one.
How many turtle diagrams should we have?
One per process in your process map. For a typical manufacturing site that is usually somewhere
between fifteen and thirty-five. The number should be driven by how the site actually operates.
Can it replace our procedures?
No. It points at them. The “how” leg names the procedures and work instructions that govern
the process; the diagram is a map, not the territory.
Does it work for ISO 9001 too?
Yes. The process approach is common to ISO 9001 and to every management system standard built on the
harmonized structure, so the technique carries across. See our guide to
the ISO 9001 clauses.
Who should own it?
The process owner. Quality can supply the template and review it, but one maintained by the quality
department for a process it does not run will not survive contact with an auditor’s questions.
All of these are covered by the IATF 16949 Toolkit, or start with the free ISO templates.

August 31, 2026
August 31, 2026
August 31, 2026
August 31, 2026

August 31, 2026