CART
Vulnerability management metrics are the indicators most likely to be reported and least likely to be useful. Total open vulnerabilities is a number that rises with every new scanner and says nothing about risk; a CVSS-weighted average hides the one critical flaw an attacker is actually using. The indicators that matter answer five questions — how big is the exposure that counts, how fast is it closed, are the deadlines met, is the backlog aging, and is the scanning complete — and they are built on a prioritization model that weights what is exploited over what is merely scored. This guide sets out the five critical vulnerability management metrics, the formulas and thresholds behind each, the data sources that make them honest, how they roll up to a board indicator, and the vanity metrics to stop reporting.
Free gap assessment
Where do you actually stand against ISO 27001?
Score every management system clause and all 93 Annex A controls, free, and get a prioritised gap list back.
Run the free ISO 27001 gap assessment → or View premium report sample
A vulnerability management metric is only as good as the definition of “critical” underneath it. CVSS alone is a poor definition: it scores technical severity, not the probability that a flaw is exploited in your environment. The prioritization model most programs now use combines three signals — CVSS (v4.0 since November 2023) for severity, EPSS from FIRST for the estimated probability of exploitation in the next 30 days, and CISA’s Known Exploited Vulnerabilities catalogue for what is being exploited in the wild — with asset criticality and internet exposure from the organization’s own inventory. The metrics below use “critical” to mean a vulnerability that scores high on that combined model: exploited or likely to be, on an asset that matters, reachable by the threat. Define it in writing before measuring anything, because every indicator inherits the definition.
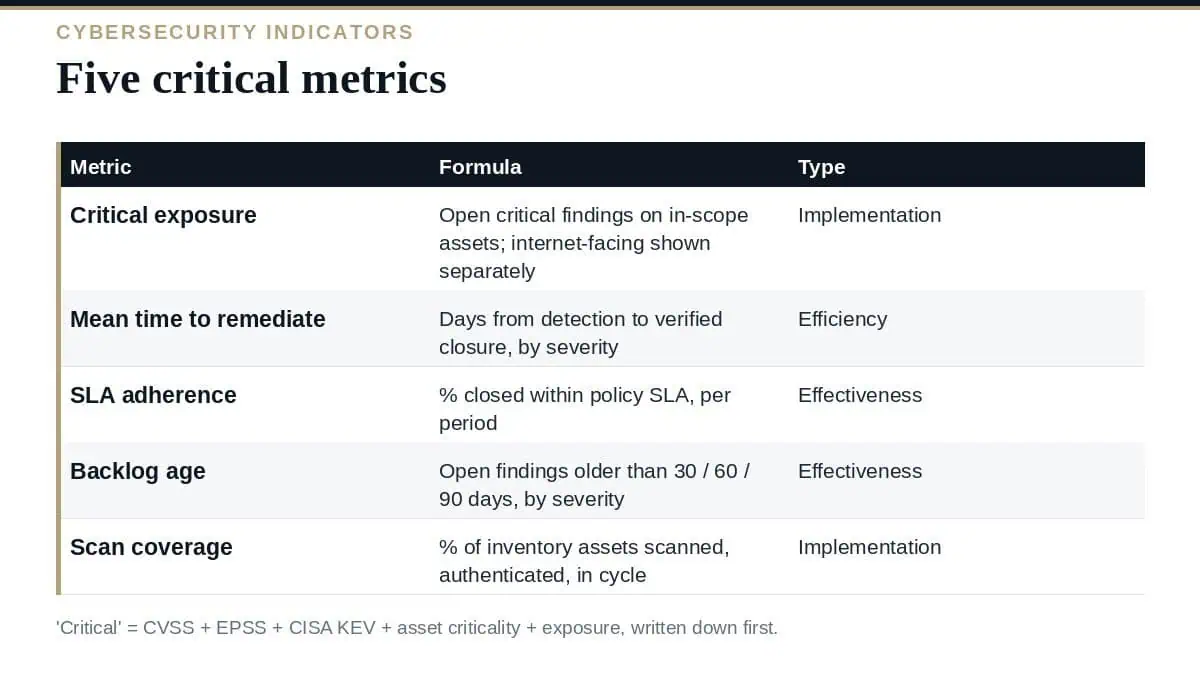
| # | Metric | Formula | Type (SP 800-55) | Threshold pattern |
|---|---|---|---|---|
| 1 | Critical exposure | Count of open critical vulnerabilities on in-scope assets, with internet-facing shown separately | Implementation | Green: 0 internet-facing critical beyond SLA; amber: 1–5; red: more |
| 2 | Mean time to remediate (MTTR) by severity | Average days from detection to verified closure, per severity band | Efficiency | Critical: green ≤ 15 days; KEV-listed: green ≤ the CISA due date |
| 3 | SLA adherence | % of vulnerabilities closed within the policy SLA for their severity, per period | Effectiveness | Green ≥ 95% critical, ≥ 90% high |
| 4 | Backlog age | Count and % of open vulnerabilities older than 30, 60 and 90 days, by severity | Effectiveness | Green: no critical > 30 days; amber: any high > 90 days |
| 5 | Scan coverage | % of in-scope assets scanned, authenticated, within the scan cycle | Implementation | Green ≥ 98%; the denominator is the asset inventory, not the scanner |
The stock indicator: how much that matters is open right now. Split it three ways — internet-facing, on crown-jewel assets, and KEV-listed — because those are the three ways a vulnerability becomes an incident. Report the count, not the percentage; five exploitable internet-facing flaws is five doors regardless of how many other findings exist. This is the number that feeds the exposure line in board cybersecurity reporting.
The flow indicator. Measured from detection — the scanner’s first observation or the vendor advisory, whichever the policy names — to verified closure, meaning a rescan confirms the fix, not a ticket marked done. Report by severity band and separately for KEV-listed items, whose remediation timelines are set externally: CISA’s Binding Operational Directive 22-01 gives federal agencies a due date per KEV entry, and many private organizations adopt those dates as their own SLA. Show the median beside the mean; a handful of unfixable legacy findings will otherwise dominate.
The compliance indicator, and the one auditors ask for. It requires an SLA policy — typical bands are 7–15 days for critical, 30 for high, 90 for medium — and it is calculated per period on the vulnerabilities that became due in that period, not on the whole backlog. Exceptions with documented risk acceptance are counted separately and reported as their own line, because an SLA adherence figure that includes silent exceptions is an SLA that is not being enforced.
The indicator that catches what SLA adherence hides. A program can hit 95% adherence every month while the same 5% ages indefinitely; the age distribution shows it. Report the count of open findings older than 30, 60 and 90 days by severity, and the oldest open critical as a single number. Backlog age is also the honest measure of risk acceptance: a critical vulnerability open for 200 days is either accepted risk with a signature or a control failure.
The indicator that decides whether the other four mean anything. Coverage is in-scope assets scanned — authenticated, within the cycle — divided by the asset inventory. The denominator has to come from the inventory or the CMDB, not from the scanner’s own list of what it found, or coverage is 100% by construction. Unscanned assets are unknown exposure, and a coverage figure below the threshold should be reported as a finding in its own right.
Five operational vulnerability management metrics become one board indicator: exposure, expressed as the count of exploitable critical vulnerabilities on assets that matter, beyond SLA, with the trend. The board does not need MTTR by severity; it needs to know whether the organization closes the doors that are open fast enough, and whether the program can see all of them. Coverage and SLA adherence are the two supporting figures worth a sentence. Our guide to cybersecurity metrics: the four types covers the roll-up logic, and cyber risk quantification shows how the exposure indicator feeds the vulnerability factor in a FAIR analysis.
Each of these has a place in an operational dashboard for the team running the scanner. None belongs in a risk report.
What are the most important vulnerability management metrics?
Critical exposure (open critical findings on assets that matter, internet-facing shown separately), mean time to remediate by severity, SLA adherence, backlog age and scan coverage against the asset inventory — each with a written formula and threshold.
How should ‘critical’ be defined?
By a prioritization model combining CVSS severity, EPSS exploitation probability, presence on CISA’s Known Exploited Vulnerabilities catalogue, asset criticality and internet exposure — written down before the metrics are computed.
What is a good mean time to remediate?
Set by policy and by external deadlines: many organizations use 7–15 days for critical, 30 for high and 90 for medium, and adopt CISA’s KEV due dates for listed vulnerabilities. Report the median beside the mean and verify closure by rescan.
Why does scan coverage matter so much?
Because every other metric is computed on scanned assets. Coverage measured against the asset inventory — not the scanner’s own list — is what tells you how much exposure is unknown.
Which metric goes to the board?
Exposure: the count of exploitable critical vulnerabilities beyond SLA on assets that matter, with its trend, supported by a sentence on coverage and SLA adherence.
Write the prioritization model down, then measure five things: what critical exposure is open, how fast it closes, whether deadlines are met, how old the backlog is, and how much of the estate is actually scanned. Verify closure by rescan, count coverage against the inventory, report the median with the mean, and retire the vanity metrics. That is a vulnerability management program that can be judged — by the board, by an auditor, and by you.
153 key risk and performance indicators keyed to NIST CSF subcategories — including the vulnerability, patching and asset-coverage measures under Identify and Protect — each with a formula, reporting frequency, thresholds, evidence and an owner, are in the Excel-based Critical IT and Cybersecurity Indicators templates, or start with the free templates.

October 11, 2026

October 11, 2026

October 11, 2026

October 11, 2026

October 11, 2026

