CART
Board cybersecurity reporting fails for a consistent reason: the security team reports what it measures, and the board needs what it governs. A slide of blocked emails and patched servers tells directors nothing about whether the organization could survive the incident that matters, whether the money is going where the risk is, or whether they are meeting the oversight duties that regulators now write into law — NIST CSF 2.0’s Govern function, DORA’s Article 5 for financial entities, NIS2’s Article 20 for essential and important entities, the SEC’s Item 106 disclosure of board oversight for US registrants. This guide sets out the six indicators a board actually needs, how each is built from operational metrics, what the report should look like, and the mistakes that turn a quarterly cyber update into theatre.
Free gap assessment
Where do you actually stand against ISO 27001?
Score every management system clause and all 93 Annex A controls, free, and get a prioritised gap list back.
Run the free ISO 27001 gap assessment → or View premium report sample
Directors are not accountable for configuring firewalls. They are accountable for deciding the organization’s risk appetite, resourcing the program to meet it, and satisfying themselves that it is working — and in a growing number of regimes that accountability is explicit. NIST CSF 2.0 added a Govern function whose Oversight category (GV.OV) expects leadership to review cybersecurity risk management outcomes and adjust strategy. DORA Article 5 puts the management body in charge of defining, approving and overseeing the ICT risk management framework. NIS2 Article 20 makes management bodies approve the Article 21 measures, oversee their implementation and undergo training, with personal liability. The SEC’s 2023 rules require registrants to describe the board’s oversight of cybersecurity risk in the annual report. Board cybersecurity reporting exists to give directors the evidence those duties require, in a form they can act on.
Free ISO 27001 risk assessment
Which of your risks sit above your appetite line?
Set your own risk criteria, pick from 61 information security risk scenarios, rate likelihood and impact, and decide how to treat each one. You get a heat map, a process score and the findings an auditor would raise, free.
Run the free risk assessment → or View premium report sample
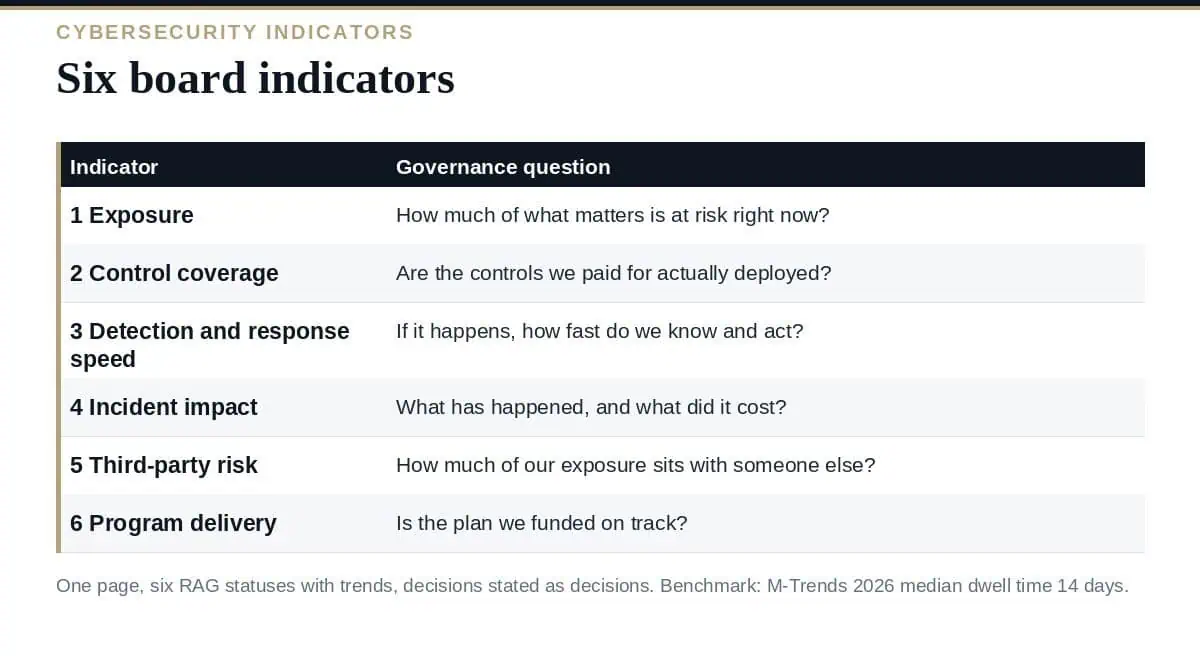
Each indicator answers one governance question and is built from a small set of operational metrics the security team already has. The point is the translation: the board sees the indicator; the metrics sit behind it for the audit committee or the CISO to unpack.
| # | Indicator | Governance question | Built from |
|---|---|---|---|
| 1 | Exposure | How much of what matters is at risk right now? | Critical assets with open high-severity vulnerabilities; internet-facing services without MFA; unsupported systems in scope |
| 2 | Control coverage | Are the controls we paid for actually deployed? | % of endpoints with EDR reporting; % of privileged accounts under PAM; % of systems within the backup and restore test cycle |
| 3 | Detection and response speed | If it happens, how fast do we know and act? | Mean time to detect; mean time to contain; mean time to recover; tabletop and restore test results |
| 4 | Incident impact | What has actually happened, and what did it cost? | Incidents by severity; hours of disruption; data exposed; direct cost; regulatory notifications made |
| 5 | Third-party risk | How much of our exposure sits with someone else? | Critical suppliers assessed and overdue; supplier incidents affecting us; concentration on single providers |
| 6 | Program delivery | Is the plan we funded on track? | Milestones met vs planned; budget consumed vs plan; audit findings open past due; headcount vs approved |
The board’s first question is the size of the target, and it should be answered in terms of the assets the business cares about, not the whole estate. “Three of the twelve crown-jewel systems have a known-exploited vulnerability open beyond SLA” is a board sentence; “4,217 vulnerabilities” is not. Exposure should trend, and the trend should be explained by the program delivery indicator.
Every control the board funded has a coverage percentage, and coverage below 100% is where incidents happen. Report the three or four controls that carry the risk appetite — EDR, MFA, privileged access, backup — and show the gap in numbers of systems, not only percentages, because “97% coverage” of 3,000 endpoints is 90 unprotected machines.
The indicator that tells directors whether the organization is resilient rather than merely defended. Mean time to detect and mean time to contain, benchmarked against the outside world — Mandiant’s M-Trends 2026 puts the 2025 global median dwell time at 14 days, with 52% of intrusions detected internally rather than by a third party — and against the organization’s own recovery objectives. Our guide to MTTD vs MTTR explains how the four response indicators are defined and why the definitions matter more than the numbers.
What happened this quarter, in business terms: severity, duration, data, cost, and whether any regulator or customer had to be told. This is the indicator that most directly supports regulatory duties — NIS2’s reporting clocks, DORA’s major-incident reporting, the SEC’s four-business-day Form 8-K materiality determination — and the one the board should be able to reconcile with the notifications the organization actually made.
For most organizations a majority of the attack surface is in someone else’s environment. The board indicator is the number of critical suppliers assessed within cycle, the number overdue, incidents originating with suppliers, and concentration — how many critical services depend on one provider. DORA makes this a management-body duty explicitly through the register of information; ISO 27001 requires it through A.5.19–A.5.22.
The indicator that closes the loop. The board approved a plan and a budget; this shows whether milestones are landing, money is being spent, audit findings are being closed and the team is staffed. A red exposure indicator with a green delivery indicator means the plan is wrong; the reverse means it is not being executed. Both are board decisions.
Board cybersecurity reporting indicators are aggregates of key risk indicators and key performance indicators that the security function tracks weekly or monthly. The discipline that makes them trustworthy is the same for every indicator: a written definition, a calculation formula, a data source, a reporting frequency, a threshold with green, amber and red bands, and an owner. NIST SP 800-55 Volume 1 (December 2024) recommends exactly those fields for every measure — unique ID, goal, scope, measure, type, formula, target, implementation evidence, time-based reference and responsible parties — and our guide to NIST SP 800-55 security measurement covers them. The board should see the thresholds, because a threshold is a risk-appetite statement, and setting it is the board’s job. Our guides to cybersecurity KRIs vs KPIs and KRI reporting cover the operational layer beneath the six indicators.
What should board cybersecurity reporting include?
Six indicators that answer governance questions: exposure, control coverage, detection and response speed, incident impact, third-party risk and program delivery — each with a RAG status, a trend, a sentence of explanation and the decisions requested.
How often should the board receive it?
Quarterly as a standing item, with an out-of-cycle report for any incident meeting the organization’s severity or regulatory threshold. Audit or risk committees usually take the detailed appendix more often.
Which regulations require board oversight of cybersecurity?
NIS2 Article 20 (management bodies approve and oversee measures, with liability), DORA Article 5 (the management body owns the ICT risk framework), the SEC’s Regulation S-K Item 106 (disclosure of board oversight) for US registrants, and NIST CSF 2.0’s Govern function as the voluntary reference.
Should the board see technical metrics?
It should see indicators built from them, with the metrics available in an appendix. Directors govern risk appetite, resourcing and oversight; the operational KRIs and KPIs are the evidence behind the indicators, not the report.
What benchmark can we give for detection speed?
External benchmarks such as Mandiant’s M-Trends — a 14-day global median dwell time for 2025 and 52% of intrusions detected internally — alongside the organization’s own recovery time objectives.
Rebuild board cybersecurity reporting around six indicators the board can govern, built from KRIs and KPIs with written definitions and thresholds the board itself has set, presented on one page every quarter with the decisions stated as decisions. That is what oversight looks like as evidence — and it is what NIS2, DORA and the SEC now expect directors to be able to show.
153 key risk and performance indicators keyed to NIST CSF subcategories, each with a reporting frequency, calculation formula, green–amber–red thresholds, evidence required and an owner, are in the Excel-based Critical IT and Cybersecurity Indicators templates, or start with the free templates.

October 11, 2026
October 11, 2026

October 11, 2026
October 11, 2026
October 11, 2026

