CART

KRI reporting fails for a predictable reason: the indicators are chosen because
they are easy to measure rather than because anyone would act differently depending on the answer. The
result is a monthly pack nobody reads and a risk committee that learns about incidents from somewhere
else.
Free gap assessment
Where do you actually stand against ISO 27001?
Score every management system clause and all 93 Annex A controls, free, and get a prioritised gap list back.
Run the free ISO 27001 gap assessment → or View premium report sample
A key risk indicator is forward-looking. It measures a condition that makes a loss more likely, so
that the organisation can intervene before the loss occurs. A metric that tells you how many incidents
happened last month is a performance measure — useful, but it reports a result rather than warning of
one.
The practical test is whether a threshold breach triggers an action that someone owns. “Percentage
of privileged accounts reviewed within the required period” is a KRI, because a fall implies stale
access that nobody has checked. “Number of tickets closed” is not, whatever it is labelled.
If you want the distinction drawn out fully, our guide to
cybersecurity KRIs and KPIs covers
it. This article is about what happens next: turning a chosen indicator into something that reports.
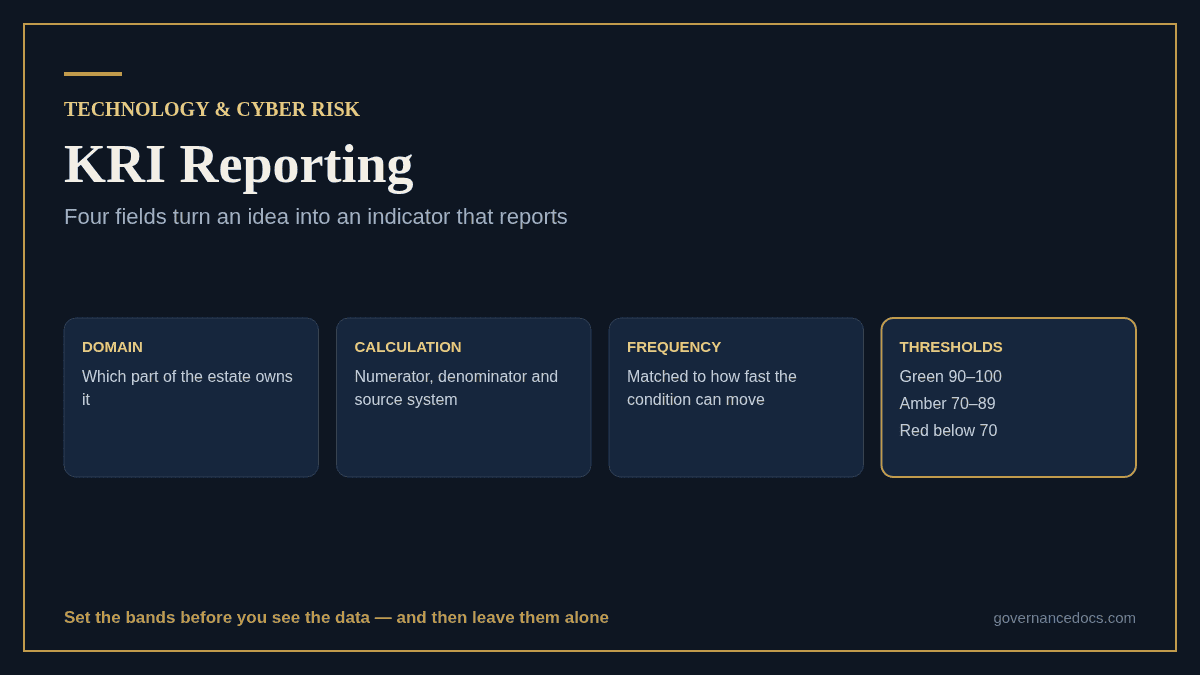
An indicator that lacks any one of these cannot be reported consistently, and the gap usually shows
up three months in when two people calculate it differently.
A red-amber-green scheme works when the bands are set in advance and applied without negotiation. A
common and defensible starting set for percentage-based control coverage is green at 90 to 100, amber
at 70 to 89, and red below 70.
Two rules keep it honest. First, set the bands before you see the data, because thresholds chosen
after the first measurement have a habit of landing just below wherever the organisation already sits.
Second, treat amber as a state that requires a plan rather than a comfortable middle — most
programmes end up with a wall of amber precisely because nothing is required of it.
The bands themselves are less important than their stability. Changing a threshold changes the
trend, and a committee that watches thresholds move learns to discount the whole pack.
Match the frequency to how fast the underlying condition can change, not to the meeting calendar.
Patching coverage, password compliance and privileged access move continuously and belong on a monthly
cycle. Encryption coverage and firewall rule reviews move in steps and are better quarterly. Anything
tied to an annual review — classification exercises, business impact analyses — should be
semi-annual at most, because reporting it monthly produces eleven identical readings and one change.
Free business impact analysis
How long can each activity really be down?
Rate the impact of an outage over time, set RTOs and maximum tolerable periods of disruption, map the people, systems and suppliers behind each activity, and get a recovery sequence back, free.
Run the free business impact analysis → or View premium report sample
A realistic technology risk set lands with most indicators monthly, a smaller quarterly group and a
handful on a longer cycle. If everything in your pack is monthly, some of it is noise.
A consolidated KRI list you can report from.
Critical IT and Cybersecurity Indicators ships 54 key risk indicators for technology and cyber risk, split evenly between information security and IT, each with its domain, status calculation, reporting frequency and green/amber/red thresholds — alongside a companion workbook of 99 performance indicators mapped to the six NIST CSF 2.0 functions.
The pack has one job: let a committee spend its time on the exceptions. That implies a shape.
Reporting every indicator at equal weight is the most common structural mistake in KRI reporting.
It fills the meeting with things that are fine.
The difference between an idea and a reportable indicator is whether these columns are filled in.
| Domain | Indicator | Frequency | Green / Amber / Red |
|---|---|---|---|
| Information security | % accounts meeting password complexity requirements | Monthly | 90–100 / 70–89 / below 70 |
| Information security | % devices holding sensitive data with encryption enabled | Quarterly | 90–100 / 70–89 / below 70 |
| Information security | % systems with a classification reviewed in period | Semi-annually | 90–100 / 70–89 / below 70 |
| IT | % network filtering rules reviewed within the required period | Quarterly | 90–100 / 70–89 / below 70 |
Note the shape: a percentage with a stated denominator, a cadence matched to how fast it moves, and
identical bands across the set. Consistent bands are what let a summary page count reds meaningfully;
indicators with bespoke thresholds cannot be aggregated.
KRI reporting only changes outcomes if a breach has a route out of the pack. Agree that route in
advance, in writing, and keep it short: who is told, within how long, who decides on remediation, and
at what point it reaches the risk committee rather than waiting for the next scheduled meeting.
The case worth planning for is the indicator that stays red across several periods. A single red is
an incident; a persistent one is either an accepted risk or an unfunded remediation, and both need a
decision recorded somewhere other than the KRI pack. Without that route, red simply becomes the new
normal colour for that row and the committee stops seeing it.
Four failures account for most of it.
Indicators chosen for data availability. The question is what would change your
decisions, not what your tooling already exports. Start from the risks in the register and work
outwards.
No owner per indicator. A red status with no name against it produces discussion
rather than action.
Thresholds that move. Covered above, and worth repeating because it is the fastest
way to destroy the pack’s credibility.
Too many indicators. Fifty or so, actively maintained, beats two hundred that are
mostly stale. A KRI you cannot calculate this month is worse than one you never had, because its
absence looks like a green.
Starting KRI reporting from nothing is easier than reforming a bad pack, and the shortcut is to work
from your risk register rather than your tooling. Take the handful of technology risks the organisation
already agrees are material, and for each one ask what would move first if it were getting worse. That
question usually produces a measurable condition, and that condition is your indicator.
Aim for a small set covering the risks you can name, with the four fields complete for every entry,
and run it for two quarters before adding anything. A short set that reports reliably earns the
committee’s attention; a long one assembled in a single workshop rarely survives its third month.
How many KRIs should we report?
Enough to cover the material risks and few enough to maintain — for most technology functions that is
a few dozen, split across information security and IT.
What is a good RAG threshold for coverage indicators?
Green 90 to 100, amber 70 to 89, red below 70 is a defensible default for percentage-based control
coverage. Set it before you measure, and leave it alone.
How often should KRI reporting happen?
Per indicator, not per pack. Monthly for conditions that change continuously, quarterly for those that
move in steps, semi-annually for anything driven by an annual review cycle.
Are KRIs and KPIs interchangeable?
No. A KRI warns that a loss is becoming more likely; a KPI reports how well something performed. Many
organisations report KPIs and call them KRIs, which is why nothing is ever acted on.
Do KRIs map to a framework?
They can, and it helps with assurance. Mapping performance indicators to the six NIST CSF 2.0
functions — govern, identify, protect, detect, respond and recover — shows coverage and exposes the
functions nobody is measuring, which is usually recover.
Good KRI reporting is mostly design work done once. Give every indicator a domain, an explicit
calculation, a frequency matched to how fast it can move, and thresholds fixed before the first
measurement. Then build the pack around exceptions and trend rather than a complete read-out.
The test is simple: if a threshold breach this month would cause someone named to do something
specific, the indicator is working. If not, it is a number on a page, and removing it will improve the
pack.
The indicator set is available as Critical IT and Cybersecurity Indicators, or start with the free ISO templates.

October 11, 2026
October 11, 2026

October 11, 2026
October 11, 2026

October 11, 2026

