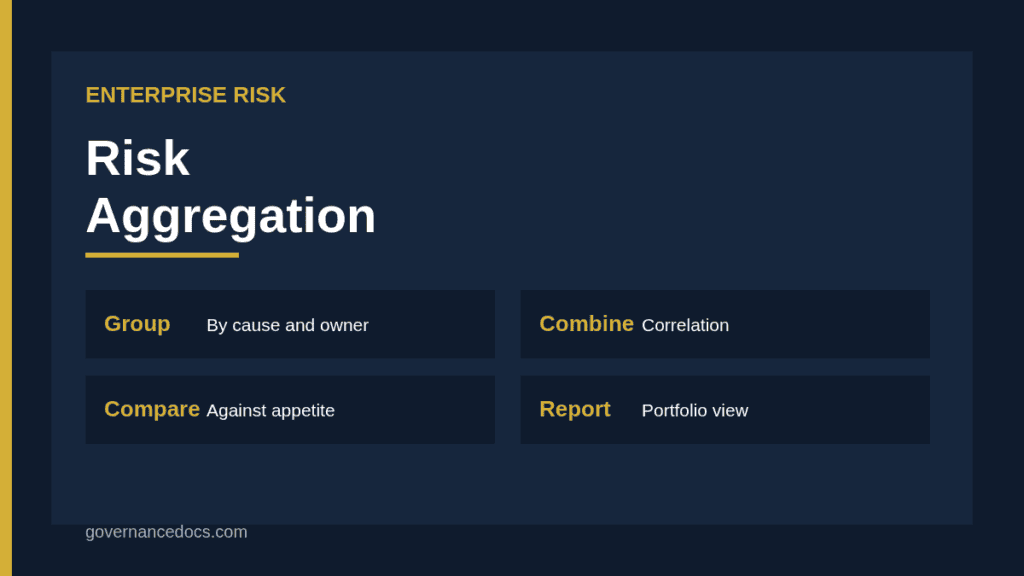
Risk aggregation is the process of combining individual risks into a view of total exposure, by category, business unit or objective. A register with two hundred rows can tell you about each risk but not about the organization’s overall position. Aggregation answers the question leaders actually ask: taken together, how exposed are we, and does that fit what we are prepared to accept?
This guide explains why risk aggregation matters, what the COSO framework says about a portfolio view, practical ways to group and combine risks, how to deal with correlation and common causes, and how to report the result in a way that supports decisions.
Why risk aggregation matters
Risks that look small on their own can add up. Ten medium-rated risks that all depend on one supplier are not ten separate problems, they are one concentrated exposure. Conversely, risks in different parts of the business may offset each other, so that the total is lower than the sum of its parts. Without aggregation, management cannot see either effect, and decisions about capital, insurance, controls and risk appetite are made in the dark.
Boards and regulators increasingly ask for this view. Our guide to risk appetite explains why totals must be compared with limits set by leadership, not just reported as a list.
What COSO says about a portfolio view
The COSO Enterprise Risk Management framework, updated in 2017, includes a principle on developing a portfolio view. Organizations are expected to consider risk from the perspective of the whole entity, or a portfolio of risks, and to see how risks at different levels combine. You can find the framework on the COSO ERM guidance page. Our overview of the COSO ERM principles shows where this principle sits in the performance component, and the comparison with ISO 31000 and COSO ERM explains how ISO 31000 approaches the same idea.
Ways to group risks for aggregation
Grouping is the first step, and the choice of grouping determines what the aggregate tells you. Try several, since each reveals something different.
Grouping
Question it answers
Example
By objective
Which strategic goals are most exposed?
Growth in a new market
By category
Where does our exposure sit: strategic, operational, financial, compliance?
Cybersecurity and technology
By business unit
Which parts of the organization carry the most risk?
Manufacturing versus retail
By common cause
What single event or dependency affects many risks?
One cloud provider, one region
By owner
Who is accountable for the largest exposure?
Chief operating officer
Grouping by common cause is often the most revealing. It exposes concentration in suppliers, systems, locations and key people that a category view hides. See our guide to third-party risk management for the supplier side of that concentration.
Methods of risk aggregation from simple to advanced
You do not need a complex model to start. The right method depends on the data you have and the decisions the results will support.
Count and rank. Count risks above a threshold in each group and rank the groups. This is crude, but it shows where attention is needed.
Score-based roll-up. Use the highest score in a group, the average, or a weighted total. Note that averages hide serious risks, so pair them with the maximum.
Heat map by group. Plot grouped exposure on a likelihood and impact grid. See our guide to the risk heat map for how to build one.
Scenario analysis. Define a few severe but plausible scenarios, such as a major supplier failure or a cyber attack, and estimate the combined effect across all affected risks.
Quantitative models. Estimate loss distributions and combine them, for example with simulation, while modeling correlation. This needs data and expertise and suits financial risk more than qualitative risks.
Why adding up scores can mislead
Qualitative scores are ordinal, meaning that a score of four is worse than three but not necessarily by the same margin as three is worse than two. Adding or averaging them produces a number that looks precise and is not. If you use scores, be transparent about the limits, keep rules simple and avoid comparing totals across groups of different size. Where the decision is important, move to scenarios or quantified estimates in monetary terms.
Correlation, common causes and diversification
How risks relate to each other matters more than how many there are. Positive correlation means they tend to occur together, as when an economic downturn increases credit losses, reduces sales and raises fraud at once. Independent risks add up less than fully, while offsetting risks can reduce the total. For qualitative work, capture this by tagging each risk with common drivers, such as a market condition, a technology, a supplier, a regulation or a location, and reviewing which tags recur.
Be careful with claims of diversification. Risks that appear independent in normal times often become correlated under stress, and the stressed condition is the one your aggregate view needs to cover. When in doubt, assume less diversification benefit than the model suggests.
Comparing the aggregate with appetite and tolerance
An aggregate figure has no meaning until it is compared with something. Set limits by category or objective, such as an acceptable range of loss, a maximum concentration in one supplier, or a maximum number of high risks in a business unit. Then show where the aggregate sits against those limits and trends over time. Key risk indicators help here, and our guide to KRI thresholds shows how to set levels that trigger action.
Reporting risk aggregation to leaders
Keep the report short. A one-page view showing exposure by category or objective, the biggest concentrations, movements since the last period, and the items needing a decision is more useful than a long register. Show the aggregate view alongside the detail behind it so that leaders can ask why a number moved. Make clear which figures are based on data and which on judgment, and state the main assumptions. Present scenarios in plain language: what happens, what it costs, how likely it is and what is being done.
A short worked example
A distribution company has 14 risks scored medium or high across finance, operations and technology. Grouping by common cause shows that nine of them depend on one warehouse management system and one logistics provider. The heat map by category looked balanced, but the common cause view shows that a single failure could disrupt order fulfilment, customer service and revenue reporting together. Management runs a scenario of a three-day outage of the system and estimates the combined effect, then compares it with the tolerance for lost sales. The result leads to funding for a backup provider and a manual fallback process, a decision the individual risk entries would not have prompted.
Data and ownership for aggregation
Aggregation is only as good as the underlying register. Before you roll anything up, confirm that every risk has an owner, a category, a linked objective, a consistent score and a review date. Agree definitions so that a high risk in one unit means the same as a high risk in another. Where units score differently, calibrate through a short workshop, since inconsistent scales make comparison meaningless.
Assign one person to own the aggregate view, usually the head of risk, and give each risk owner a short deadline to update entries before each cycle. Record the date of the data used in the aggregate so readers know how current it is. If some risks are missing, say so in the report rather than presenting the picture as complete. Leaders can accept an incomplete view if they know it is incomplete, but not one that only looks finished.
Common mistakes in risk aggregation
Teams average away the risks that matter, aggregate only within silos, ignore common causes, treat scores as numbers that can be added, report totals without appetite and leave the method undocumented. They also aggregate an out-of-date register. Keep the register current, document the method and its limits, and test the results against real events. The enterprise risk register guide explains how to keep the underlying data in shape.
Building an aggregation-ready assessment
If you want a starting structure, the Enterprise Risk Assessment Report and Workbook provides a structured assessment, scoring and register with the fields needed to group and roll up risks. Whatever tool you use, tag every risk with a category, owner, objective and common driver from the start, so that risk aggregation is a filter on existing data instead of a separate project each quarter.
Risk aggregation FAQ
What is risk aggregation?
It is the combining of individual risks into a view of total exposure by category, business unit, objective or cause, so leaders can compare the whole with their appetite.
Can I add up risk scores?
Only with care. Qualitative scores are ordinal, so sums and averages can mislead. Use maximum values, counts by band, heat maps and scenarios, and quantify where the decision justifies it.
How do I deal with correlated risks?
Tag risks with common drivers, review which drivers recur and use scenarios that stress several risks together. Assume risks are more correlated in a crisis than in normal times.
Does COSO require a portfolio view?
The COSO ERM framework includes a principle on developing a portfolio view, which expects organizations to consider risk at the entity level as well as for individual units or risks.
How often should aggregation be done?
Refresh it with each reporting cycle, commonly quarterly, and after major events. Keep the underlying register current so the aggregate is reliable.