CART
LCR vs NSFR is the comparison between Basel III’s two liquidity ratios, and the confusion between them is structural: both are expressed as a percentage that must be at least 100%, both are built from the same balance sheet, and both arrived in the same reform package. But the Liquidity Coverage Ratio asks whether a bank can survive 30 days of acute stress with the liquid assets it holds today, and the Net Stable Funding Ratio asks whether the bank’s assets are funded by liabilities that will still be there in a year.
One is a stock of high-quality liquid assets against a stressed outflow; the other is a structural funding profile. The Basel Framework keeps them in separate standards — LCR (chapters LCR10 to LCR99) and NSF (NSF10 to NSF99) — and they bind different banks in different ways. This guide sets out the seven differences between the two, how each is calculated, the factors that drive them, why a bank can pass one and fail the other, and how the ILAAP ties them together.
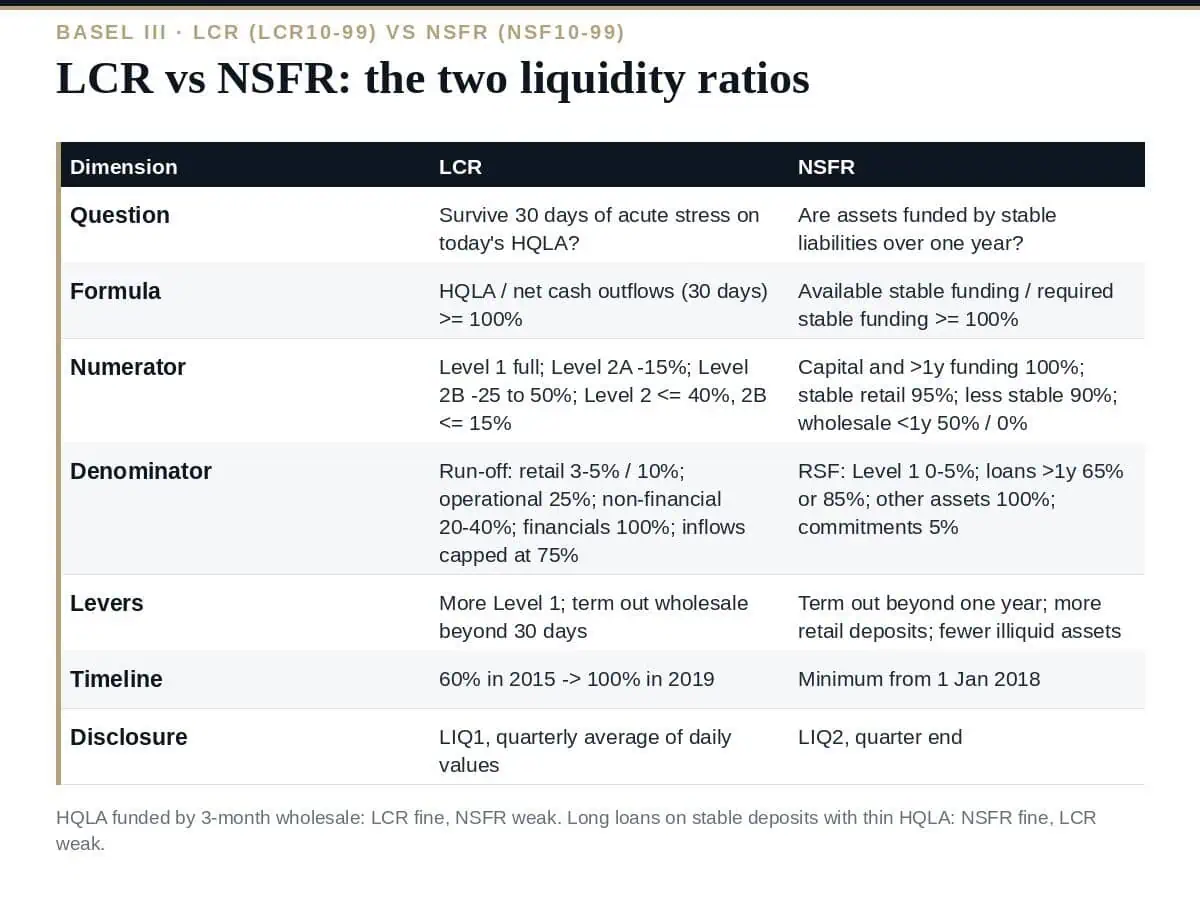
| Dimension | Liquidity Coverage Ratio (LCR) | Net Stable Funding Ratio (NSFR) |
|---|---|---|
| Question | Can the bank meet net cash outflows under a 30-day acute stress from its stock of unencumbered high-quality liquid assets? | Is the bank’s asset and off-balance-sheet profile funded by stable sources over a one-year horizon? |
| Formula | Stock of HQLA ÷ total net cash outflows over the next 30 calendar days | Available stable funding (ASF) ÷ required stable funding (RSF) |
| Minimum | 100% (phased in from 60% in 2015 to 100% in 2019) | 100%, from 1 January 2018 in the Basel timetable |
| Horizon | 30 calendar days, stressed | One year, structural |
| Numerator | Level 1 assets (cash, central bank reserves, qualifying sovereigns) at full value; Level 2A at a 15% haircut; Level 2B at 25–50% haircuts; Level 2 capped at 40% of HQLA and Level 2B at 15% | Liabilities and equity weighted by stability: regulatory capital and liabilities over one year at 100%; stable retail deposits at 95%; less stable retail at 90%; wholesale funding under one year at 50% or 0% by counterparty |
| Denominator | Outflows by run-off rate (retail stable 3–5%, less stable 10%, operational wholesale 25%, unsecured non-financial corporate 20–40%, financial institutions 100%) less inflows capped at 75% of outflows | Assets weighted by the funding they require: Level 1 HQLA at 0–5%; unencumbered loans over one year at 65% (residential mortgages at 35% risk weight) or 85%; other assets at 100%; off-balance-sheet commitments at 5% |
| Levers | Hold more Level 1 assets; lengthen wholesale funding beyond 30 days; reduce committed facilities | Lengthen funding beyond one year; raise retail and operational deposits; shorten or shrink illiquid assets |
| Basel Framework chapters | LCR10–LCR99 | NSF10–NSF99 |
The first LCR vs NSFR difference is what kind of measure each is. The LCR is a scenario: a combined idiosyncratic and market-wide shock in which retail deposits run off at defined rates, wholesale funding is partly lost, secured funding rolls at haircuts, committed facilities are drawn and derivative collateral is called, all over 30 calendar days. The bank must hold enough unencumbered HQLA to cover the net outflow. The NSFR is a balance-sheet weighting: every liability is scored for how likely it is to remain over a year, every asset for how much stable funding it needs, and the first must cover the second. The LCR can move sharply in a week; the NSFR moves with the balance sheet.
In the LCR only high-quality liquid assets count, and the standard grades them: Level 1 (cash, central bank reserves, qualifying sovereign and central-bank debt) without limit or haircut; Level 2A (certain sovereign, public-sector and covered bonds, and corporate debt rated AA- or better) at a 15% haircut; Level 2B (lower-rated corporate debt, certain equities and residential mortgage-backed securities) at 25% to 50% haircuts, with Level 2 capped at 40% of the stock and Level 2B at 15%. In the NSFR every asset appears, weighted by the stable funding it requires: HQLA needs little, a five-year loan needs most of its value funded, and encumbered assets need funding for the term of the encumbrance.
The LCR treats liabilities as outflows: a stable retail deposit runs off at 3% or 5% over the 30 days, a less stable one at 10%, operational wholesale deposits at 25%, unsecured wholesale from non-financial corporates at 20% or 40%, and funding from financial institutions at 100%. The NSFR treats the same liabilities as sources: capital and funding with more than a year to run count at 100%, stable retail deposits at 95%, less stable at 90%, wholesale under a year at 50% or, from financial institutions with less than six months, 0%. The same deposit book therefore does two jobs, and a bank that improves one ratio by changing its funding mix usually moves the other.
| Balance sheet | LCR | NSFR | Why |
|---|---|---|---|
| Large HQLA portfolio funded by three-month wholesale borrowing | Comfortable | Weak | HQLA covers the 30-day outflow, but three-month funding gets 50% or 0% ASF while the assets still need funding |
| Long-dated mortgage book funded by stable retail deposits, thin HQLA | Weak | Comfortable | Stable deposits at 95% ASF fund the 65% RSF mortgages, but the 30-day stress finds too little Level 1 |
| Trading book financed by short repo | Depends on collateral | Weak | Encumbered assets need funding for the encumbrance term; short secured funding earns little ASF |
| Retail bank with matched deposits and loans | Comfortable | Comfortable | The classic case both ratios were designed to reward |
The design is deliberate. The LCR was calibrated on the 2007–08 experience of banks that were solvent on paper and out of cash in a fortnight; the NSFR on the structural over-reliance on short-term wholesale funding that made the fortnight possible. Together they close both gaps; either alone leaves one open.
Both ratios are reported to supervisors and disclosed under Pillar 3: the LCR as an average of daily observations over the quarter in the LIQ1 template, the NSFR as a quarter-end figure in LIQ2, each with the weighted and unweighted values that let a reader see the composition. Our guide to Pillar 3 disclosure covers the templates.
National implementation adds an LCR vs NSFR difference of its own. The LCR was implemented earlier and more uniformly; the NSFR later and with more variation — the US, for example, applies a full NSFR only to its largest banks and reduced or no requirements to smaller ones, and the EU’s CRR2 introduced a simplified NSFR for small and non-complex institutions. The Basel Committee’s implementation monitoring treats them as separate standards, and a bank operating across borders should expect different scope and calibration for each. Our guide to Basel III covers the adoption picture.
Neither ratio is the bank’s own view of liquidity adequacy; both are regulatory minimums. The internal liquidity adequacy assessment process takes them as constraints, adds the bank’s own stress scenarios over horizons the LCR does not cover — intraday, and beyond 30 days — and its own view of stable funding, and produces the internal buffers and funding plan. The ECB’s guide to the ILAAP expects both a normative perspective (projected compliance with the LCR, NSFR and supervisory requirements) and an economic perspective (the bank’s own assessment). Our guide to the ILAAP covers the seven principles.
What is the difference between LCR vs NSFR?
The Liquidity Coverage Ratio requires a stock of high-quality liquid assets at least equal to net cash outflows over a 30-day stress; the Net Stable Funding Ratio requires available stable funding at least equal to the stable funding the bank’s assets need over one year. One is a short-term stress buffer, the other a structural funding standard; both must be at least 100%.
Which came first?
The LCR, phased in from 60% in 2015 to 100% in 2019; the NSFR became a minimum standard from 1 January 2018 in the Basel timetable, with national implementation varying.
Can a bank meet the LCR and fail the NSFR?
Yes. A bank holding ample HQLA funded by short wholesale borrowing passes the 30-day test but earns little available stable funding; the reverse — stable deposits funding long loans with thin HQLA — passes the NSFR and fails the LCR.
What counts as HQLA?
Level 1 assets (cash, central bank reserves, qualifying sovereign debt) without limit; Level 2A at a 15% haircut and Level 2B at 25–50%, with Level 2 capped at 40% of the stock and Level 2B at 15%.
How are they disclosed?
Under Pillar 3: the LCR in template LIQ1 as a quarterly average of daily values, the NSFR in LIQ2 at quarter end, both with weighted and unweighted components.
Read LCR vs NSFR as two answers to two questions — thirty days of stress and a year of structure — from one balance sheet. Model them together, price the levers, watch the maturity cliffs and encumbrance, hold internal minimums above 100%, and let the ILAAP carry the bank’s own view on top of both.
The Liquidity Risk Management Policy, the Contingency Funding Plan, the ILAAP document, the Metrics and KRI Catalogue and the Stress Testing Framework are in the Basel III Prudential Risk Toolkit, or start with the free templates.

September 20, 2026
September 19, 2026

September 19, 2026

September 19, 2026

September 19, 2026

