CART

Capital buffers are the layer of common equity Basel III stacks on top of the minimum ratios, and they work differently from the minimums: a bank that breaches a minimum is in breach; a bank that dips into a buffer keeps operating but loses the freedom to pay dividends, buy back shares and pay discretionary bonuses until it rebuilds. The Basel Framework defines three in chapters RBC30 and RBC40 — the capital conservation buffer of 2.5% of risk-weighted assets, the countercyclical capital buffer of 0% to 2.5% set by national authorities, and the higher loss absorbency surcharge of 1% to 3.5% for global systemically important banks — plus a leverage ratio buffer for G-SIBs and national add-ons such as domestic systemic and systemic risk buffers. All are met with Common Equity Tier 1, all sit above the 4.5% CET1 minimum, and together they decide the distribution constraints that make the buffers bite. This guide sets out the three Basel buffers and the national additions, the conservation ladder that restricts distributions, how the G-SIB surcharge is set and why the US version is being re-proposed, and how to run the buffer stack in capital planning.
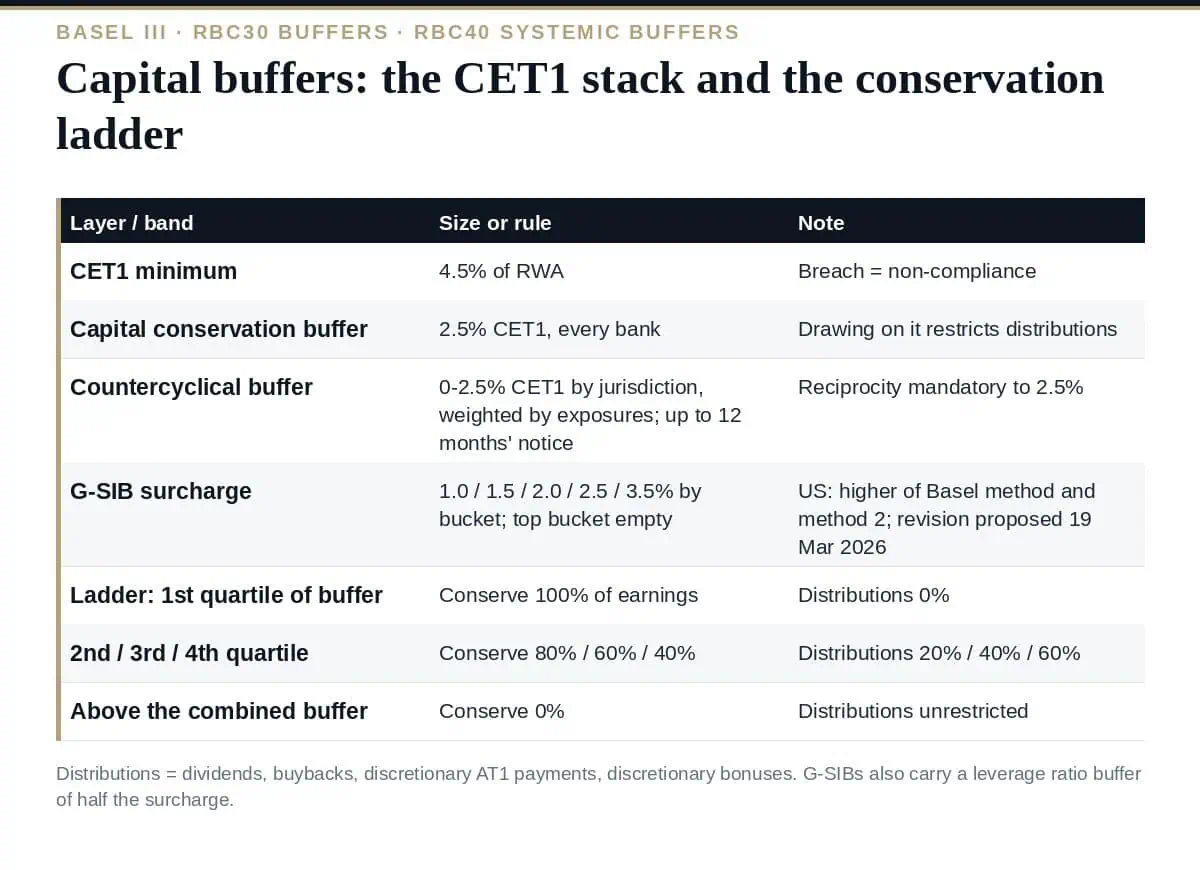
| Buffer | Size | Set by | Purpose | Basel Framework |
|---|---|---|---|---|
| Capital conservation buffer (CCB) | 2.5% of RWA, in CET1 | The standard, for every bank | A cushion to absorb losses in stress while keeping the bank above the minimum; drawing on it triggers distribution constraints | RBC30 |
| Countercyclical capital buffer (CCyB) | 0% to 2.5% of RWA, in CET1 (authorities may set higher, but reciprocity is mandatory only up to 2.5%) | Each national authority for exposures in its jurisdiction; a bank’s rate is the weighted average across its private-sector credit exposures | Built up when credit growth is judged excessive, released in a downturn so banks keep lending; announced up to 12 months before it takes effect | RBC30 |
| G-SIB higher loss absorbency | 1.0%, 1.5%, 2.0%, 2.5% or 3.5% of RWA, in CET1, by bucket | The Basel Committee’s indicator-based method and the FSB’s annual G-SIB list; national authorities apply it | Reduces the probability of failure of the banks whose failure would do most damage; the top bucket is kept empty as a disincentive to growing more systemic | RBC40 |
National frameworks add capital buffers of their own to the stack. Domestic systemically important bank buffers apply the G-SIB logic to nationally important banks; the EU’s systemic risk buffer and O-SII buffer, the UK’s O-SII and PRA buffers, and Pillar 2 add-ons everywhere sit alongside or on top. A bank’s “combined buffer requirement” in EU terms is the sum, and the distribution constraints apply to the whole of it. Our guide to Basel III covers the framework the buffers belong to.
Capital buffers are usable by design — the point of the conservation buffer is that it can be drawn down in stress — but using them costs the bank its distributions. RBC30 divides the buffer into four quartiles and fixes the minimum share of earnings that must be conserved when CET1 sits in each.
| CET1 ratio (2.5% CCB only, 4.5% minimum) | Position within the buffer | Minimum conservation of earnings | Maximum distributions |
|---|---|---|---|
| 4.5% to 5.125% | First quartile | 100% | 0% |
| 5.125% to 5.75% | Second quartile | 80% | 20% |
| 5.75% to 6.375% | Third quartile | 60% | 40% |
| 6.375% to 7.0% | Fourth quartile | 40% | 60% |
| Above 7.0% | Outside the buffer | 0% | 100% |
Where the countercyclical buffer and a systemic surcharge apply, the ladder stretches to cover the combined buffer, and the quartiles are recalculated on the larger total. “Distributions” means dividends, share buybacks, discretionary payments on other Tier 1 instruments and discretionary bonuses; the constraint is on the maximum distributable amount, calculated from earnings after tax, and it applies automatically rather than at supervisory discretion. That automaticity is what makes the buffer a real constraint and, in practice, why banks manage to a management buffer above the regulatory stack rather than to the stack itself.
The Basel Committee scores banks annually on five categories of systemic importance — size, interconnectedness, substitutability, complexity and cross-jurisdictional activity — and the Financial Stability Board publishes the list of G-SIBs each November with their buckets; the surcharge applies from the January fourteen months later. The US applies the higher of two methods — the Basel method and its own method 2, which replaces substitutability with reliance on short-term wholesale funding and generally produces a higher number — and the third of the three proposals the US agencies published on 19 March 2026 would revise how systemic risk is measured in that surcharge framework and the FR Y-15 report. G-SIBs also carry a leverage ratio buffer equal to half their risk-based surcharge, with its own conservation ladder. Our guide to the Basel III endgame covers the March 2026 proposals.
The CCyB is the one of the capital buffers that moves. Authorities set a rate for exposures in their jurisdiction — several kept a positive “neutral” rate through the early 2020s and released it in stress — and a bank’s own rate is the weighted average of the rates where its private-sector credit exposures sit, which is why the Pillar 3 template CCyB1 discloses exposures by geography. Increases are pre-announced by up to 12 months; decreases take effect immediately. For capital planning the consequences are two: the buffer requirement is a moving target across jurisdictions, and the release in a downturn is only useful if the bank is willing to run inside the buffer and accept the distribution constraints that follow.
What are the Basel III capital buffers?
Common Equity Tier 1 layers above the 4.5% minimum: the 2.5% capital conservation buffer for every bank, the 0–2.5% countercyclical buffer set by national authorities and averaged across a bank’s exposures, and the 1–3.5% higher loss absorbency surcharge for global systemically important banks, plus national systemic buffers and Pillar 2 add-ons. A bank inside its buffers keeps operating but faces automatic limits on dividends, buybacks and bonuses.
What happens if a bank uses its buffer?
Nothing supervisory happens automatically, but distributions are capped by the conservation ladder — 0%, 20%, 40% or 60% of earnings distributable depending on how deep into the combined buffer the CET1 ratio sits — until the buffer is rebuilt.
How is the G-SIB surcharge decided?
By the Basel Committee’s indicator-based score across size, interconnectedness, substitutability, complexity and cross-jurisdictional activity, published in the FSB’s annual list with buckets from 1.0% to 3.5%; the US applies the higher of that method and its own method 2, which the agencies proposed to revise on 19 March 2026.
Can the countercyclical buffer exceed 2.5%?
An authority may set a higher rate for its own jurisdiction, but other jurisdictions are required to reciprocate only up to 2.5%.
Are buffers the same as Pillar 2?
No. Pillar 2 requirements are bank-specific add-ons from supervisory review; the buffers are standard layers that trigger distribution constraints. Both sit above the minimum and both belong in the capital plan.
Run capital buffers as a stack with a ladder: know the combined buffer per entity, the CET1 ratio at which each distribution constraint bites, the CCyB rates and their announcement lead in every material jurisdiction, and the management buffer that keeps the board’s distribution policy intact in stress. The buffers are usable by design; the decision to use them is the one to make before it is needed.
The Capital Management Policy, the Capital Planning and Forecasting Procedure, the Risk Appetite Statement, the Stress Testing Framework and the Recovery Plan are in the Basel III Prudential Risk Toolkit, or start with the free templates.

October 11, 2026
October 11, 2026

October 11, 2026

October 11, 2026

October 11, 2026

