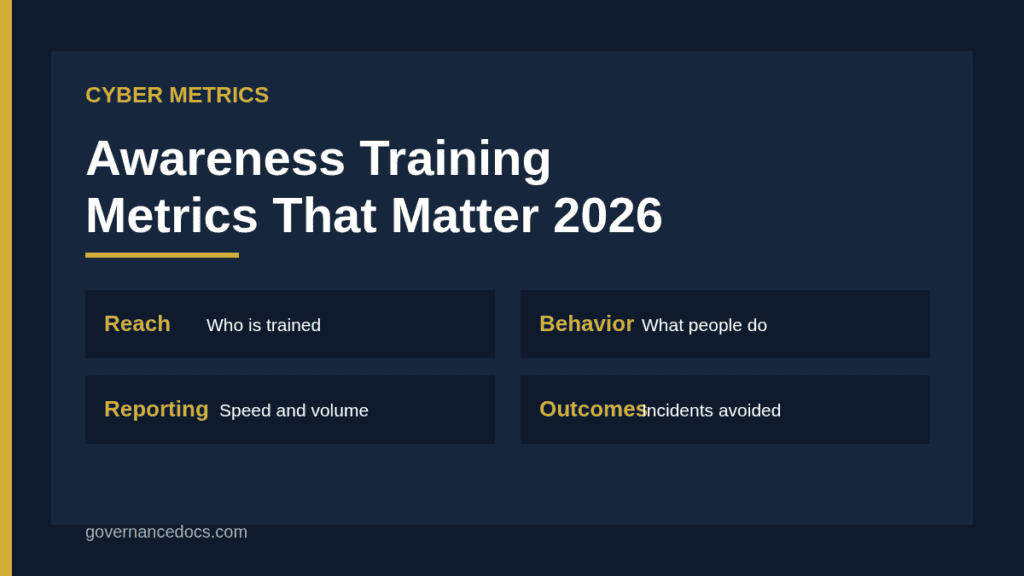
Security awareness training metrics tell you whether your programme changes what people do, not just whether they clicked through a course. Most organizations can report a completion rate, but leaders and auditors increasingly ask a harder question: did the training reduce risk? NIST Special Publication 800-50 Revision 1, published in September 2024 as guidance for building a cybersecurity and privacy learning programme, puts behavior change at the centre and includes suggested metrics and evaluation methods to help programmes improve.
What NIST SP 800-50 Rev. 1 says about learning programmes
The publication describes a life cycle approach to building a cybersecurity and privacy learning programme. It covers three learning dimensions, awareness, training and education, tailored to different audiences and roles, and it stresses that the goal is behavior change that supports risk management and cultivates a security and privacy culture. It also provides suggested metrics and evaluation methods so that programmes can be reviewed and updated regularly.
The metrics below are our suggestions, in the spirit of that guidance, and are not a list taken from the publication. Read the document itself for its own recommendations.
Three layers of security awareness training metrics
Layer
Question it answers
Examples
Reach and delivery
Did the right people get the right content?
Completion by role, time to complete, new starter coverage
Incidents caused by human error, time to report, repeat offenders
Layer 1: reach and delivery
Reach metrics are necessary but weak on their own. Track completion by department and role, and pay attention to who has not been reached: contractors, part-time staff and executives are commonly missed. Measure time from hire to first training, and time from a new campaign to full completion. Report the results by group, so managers can see where to act. Use these metrics to spot delivery problems, not as proof of effect.
Layer 2: behavior metrics
Behavior metrics show whether people apply the training. The strongest single measure in many programmes is the rate at which staff report suspicious messages, and how fast they do it. A rising report rate usually indicates a healthier culture than a falling click rate alone, because staff who click and report quickly help incident response.
Simulated phishing. Track click rate, credential submission rate and report rate over time, by group and by difficulty.
Reporting speed. Median time from message arrival to first report.
Secure practice adoption. Percentage of staff using MFA, a password manager or encrypted devices.
Policy exceptions. Number of unsanctioned tools or data handling exceptions raised.
Knowledge checks. Short quizzes on key topics, tracked over time, with results used to improve content.
Handle phishing simulations with care
Simulations give useful data, but they can damage trust if used punitively. Keep results confidential at the individual level, offer immediate learning when someone clicks and avoid publishing names. Vary the difficulty and themes, and compare like with like. A campaign that is harder than the last will show a higher click rate without any change in real risk. Record the difficulty rating so trends make sense.
Layer 3: outcome metrics
Outcome metrics connect the programme to actual incidents. Count incidents that involved human error, such as misdirected email, lost devices or credential theft through phishing, and track trends. Measure time from a user noticing something to the security team learning of it. Where possible, link incidents to training history, but be careful about drawing conclusions from small numbers. Use these metrics with the KRI reporting you already produce, so the awareness programme sits within the wider risk picture.
Program health metrics
Content freshness. Percentage of modules updated in the last twelve months.
Role coverage. Whether high-risk roles, such as finance, administrators and developers, receive role-based training.
Feedback scores. Learner ratings and comments.
Cost and effort. Time spent per employee, and cost per person trained.
Improvement actions. Number of changes made in response to data.
Setting targets and thresholds
Targets should be realistic and tied to risk. Rather than aiming for zero clicks, aim for a steady rise in report rate and a steady fall in credential submission. Set thresholds that trigger action, for example when a department’s report rate falls below an agreed level or when a repeat clicker pattern appears. Our guide to KRI thresholds explains how to set levels that prompt a response.
Reporting to leaders
Keep the report short. A one-page view might show three or four metrics with trends, a comment on what changed and what you will do next. Emphasise behavior and outcomes, and put reach metrics in an appendix. Explain limitations, such as small sample sizes or differences in simulation difficulty. Executives will trust a candid report more than one that claims perfect results. The standard for measurement guidance from NIST, NIST SP 800-55, can help structure the wider set.
Choosing security awareness training metrics by audience
One set of security awareness training metrics rarely suits every reader. Front-line staff need simple feedback on what to do differently. Managers need to see how their own team compares with others. The board needs a small number of indicators that show whether human risk is rising or falling. Decide who reads each metric before you start collecting it, and drop any metric nobody will act on.
A practical split is three tiers. Operational metrics, such as completion by department or reports per week, go to programme owners. Management metrics, such as repeat clickers by team, go to line managers and the security lead. Board-level metrics are the two or three that link behaviour to risk, and they belong in your board cybersecurity reporting pack rather than in a separate awareness report.
Common mistakes with security awareness training metrics
The most common mistake is measuring activity instead of change. Completion rates show that people opened the course, not that they behave differently. Security awareness training metrics only become useful when at least some of them track behaviour over time: reporting rates, time to report, repeat failures and the proportion of staff who report a simulated message before anyone clicks it.
A second mistake is punishing the numbers. If a high click rate leads to blame, staff stop reporting and the metric improves for the wrong reason. Present results at team level, celebrate reports, and keep individual data for coaching only. A third is changing the difficulty of simulations without noting it, which makes trend lines meaningless. Record the theme and difficulty of each exercise next to its result so a rise or fall can be explained.
Setting a baseline for security awareness training metrics
Run a first round of measurement before changing anything, and record it as your baseline. Use the same sampling method each period so comparisons hold. Treat the first quarter of security awareness training metrics as a measuring exercise, not a scorecard, and agree in advance what movement counts as meaningful. A small population makes percentages swing widely, so show counts alongside percentages for teams under about 30 people.
Once the baseline exists, set targets as ranges rather than single values, in the same way you would set thresholds for other indicators. Our guide to KRI thresholds explains how to set green, amber and red bands that trigger a defined response rather than a debate.
A hypothetical example
A hypothetical regional insurer used to report a 98 percent training completion rate. After moving to behavior metrics, it discovered that only a small share of staff ever reported phishing, and that report times averaged most of a working day. It introduced a one-click report button, short role-based sessions for finance staff and positive recognition for reports. Over two quarters the report rate rose and the median report time fell to under an hour, while credential submissions in simulations dropped. The security team used the faster reporting to block a real campaign before it spread. The example is invented for illustration.
Common mistakes with security awareness training metrics
Reporting completion rates as if they proved risk reduction.
Comparing simulation results without accounting for difficulty.
Punishing staff who click, which discourages reporting.
Ignoring contractors and high-risk roles.
Using too many metrics, so nobody acts on any.
Not changing the programme based on the data.
Read the source guidance in NIST SP 800-50 Rev. 1 and adapt it to your organization and jurisdiction.
Templates for security awareness training metrics
To avoid building metric definitions, dashboards and reporting templates from scratch, the IT and Cybersecurity Indicators pack provides documents you can adapt to your programme.
Security awareness training metrics FAQ
Is completion rate a useful metric?
It shows reach, which matters for compliance, but it does not show whether behavior changed.
What is the best single behavior metric?
Many programmes rely on the phishing report rate and time to report, since they show engagement and help incident response.
Should we publish who clicked?
No. Keep individual results confidential and use them for coaching, so staff continue to report.
How often should we report?
Quarterly to leadership is common, with monthly operational reviews by the security team.
Where does NIST address this?
NIST SP 800-50 Rev. 1, published in September 2024, covers building a learning programme and includes suggested metrics.