CART
Bow tie analysis is the risk assessment technique that puts a single unwanted event in the centre of a page, its causes on the left, its consequences on the right, and the controls that stand between them on the lines that join them — and it is the one technique in IEC 31010:2019 that a board, an operator and an auditor can all read without training.
IEC 31010 files it in Annex B.4, techniques for analysing controls, alongside HACCP and layers of protection analysis, because that is what a bow tie does: it makes visible which barriers prevent the causes from reaching the event and which mitigate the event once it has happened, and it exposes the escalation factors that degrade those barriers.
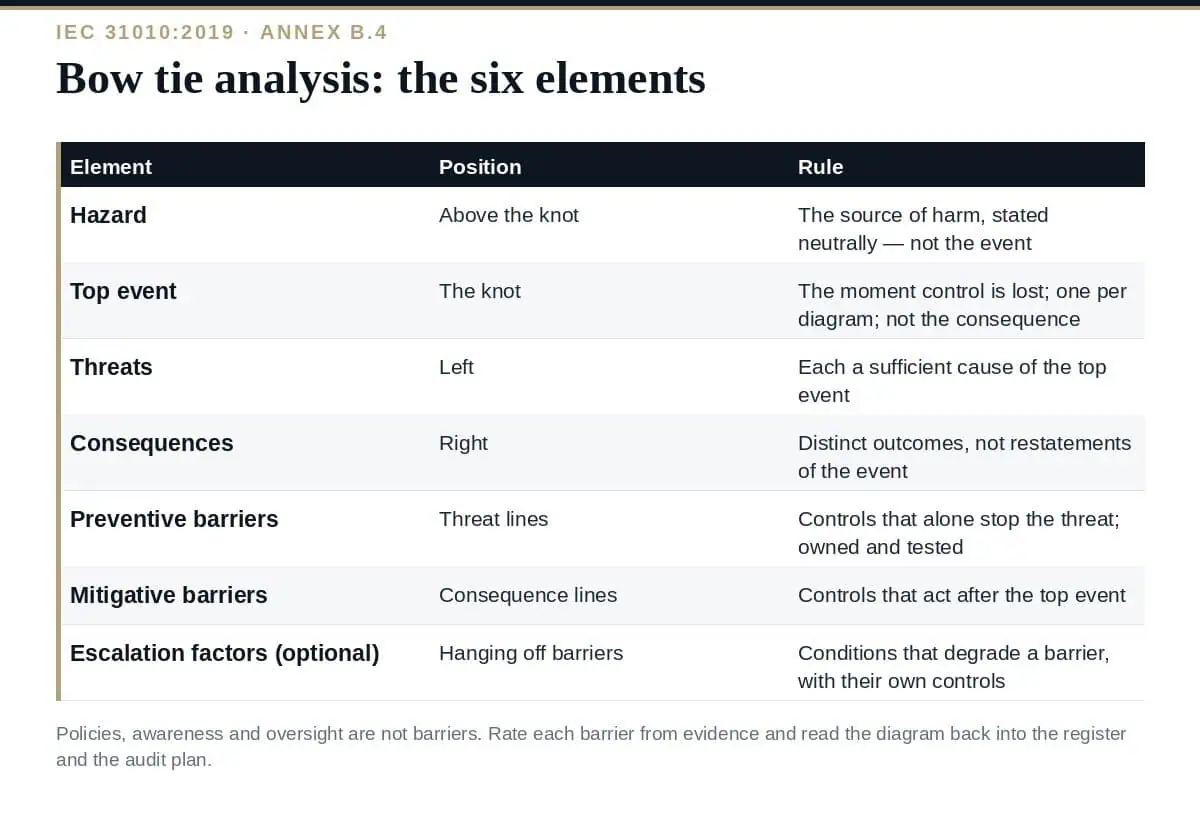
Six elements make up the diagram — the hazard, the top event, the threats, the consequences, the preventive barriers and the mitigative barriers — with escalation factors and their controls as the optional seventh and eighth. This guide sets out the six elements with the rules for each, walks through building a bow tie from a register line, explains how it connects to the ISO 31000 process and to risk criteria, shows a worked example, and lists the errors that turn a bow tie into decoration.
Free gap assessment
Is risk management actually changing decisions?
A maturity assessment against all eight principles, the framework and the process, free. Nobody can certify you to ISO 31000, so this scores distance from good practice instead.
Run the free ISO 31000 maturity assessment → or View premium report sample
IEC 31010 groups techniques by purpose, and the bow tie’s purpose is control analysis. Identification techniques find events; likelihood and consequence techniques estimate them; the bow tie shows what the organisation relies on to keep an event from happening and to limit it when it does. It combines the left half of a fault tree — causes leading to an event — with the right half of an event tree — outcomes following it — in a form that omits the logic gates and probabilities and keeps the barriers.
That trade is deliberate: a bow tie is less rigorous than the trees and far more communicable, which is why it is used for major-accident hazards in process safety, for critical risks in enterprise registers, and increasingly for cyber and operational risk. Our guide to IEC 31010 covers the other 40 techniques and how to combine them.
| Element | Where on the diagram | Definition | Rule |
|---|---|---|---|
| 1. Hazard | Above the knot | The source of harm the organisation deals with as part of its business — flammable inventory, customer data, a fleet, a payment system | State it neutrally; the hazard is not the event |
| 2. Top event | The knot | The moment control over the hazard is lost — loss of containment, unauthorised access to data, vehicle leaves the road, payment sent to the wrong account | One top event per diagram; not the consequence |
| 3. Threats | Left side | The causes that can lead directly to the top event — corrosion, phishing, driver fatigue, fraudulent instruction | Each threat must be able to cause the top event on its own |
| 4. Consequences | Right side | The outcomes if the top event occurs — fire, regulatory fine and customer harm, injury, financial loss | Each is a distinct outcome, not a restatement of the event |
| 5. Preventive barriers | On the lines from threats to the top event | Controls that stop a threat from causing the top event — inspection, MFA, hours-of-service limits, dual authorisation | Each barrier must be capable of stopping the threat alone, and be owned |
| 6. Mitigative barriers | On the lines from the top event to consequences | Controls that limit the consequence once the event has occurred — detection and isolation, incident response and breach notification, airbags, recall of payment | Each must act after the top event; prevention does not belong here |
| Optional element | Where | What it adds |
|---|---|---|
| Escalation factors | Hanging off a barrier | Conditions that defeat or degrade the barrier — the inspector is untrained, MFA is bypassed for contractors, the driver falsifies the log |
| Escalation-factor controls | On the escalation factor | Controls on the condition — training and certification, no exceptions policy, tachograph audit |
The rule that matters most is the barrier rule: a barrier is a control that, on its own, can stop the threat or limit the consequence, and that someone owns and someone tests. “Policy”, “awareness” and “management oversight” fail the rule — they are escalation-factor controls at best — and a bow tie that lists them as barriers has hidden the fact that the organisation relies on two real controls, not seven.
| ISO 31000 step | What the bow tie contributes |
|---|---|
| 6.3 Scope, context and criteria | The hazard and top event define the scope of the assessment; the criteria decide which consequences count as significant |
| 6.4.2 Risk identification | Threats and consequences are the identified sources and outcomes; the diagram makes gaps visible |
| 6.4.3 Risk analysis | The barriers are the ‘existing controls’ whose effectiveness ISO 31000 asks to be considered; the diagram is the analysis of them |
| 6.4.4 Risk evaluation | Comparison with criteria per consequence line, informed by barrier effectiveness |
| 6.5 Risk treatment | Treatment options are new or strengthened barriers and escalation-factor controls, placed on the diagram |
| 6.6 Monitoring and review | Barrier testing results update the effectiveness ratings; a failed test changes the current risk |
| 6.7 Recording and reporting | The bow tie is a reporting form in its own right — IEC 31010 lists it among the recording and reporting uses |
Our guide to risk criteria covers the thresholds each consequence line is evaluated against.
| Element | Content |
|---|---|
| Hazard | Customer payment instructions processed by the treasury team |
| Top event | A payment is released to an account controlled by a fraudster |
| Threats and preventive barriers | Business email compromise of a customer → call-back verification on a known number; payment-detail change controls. Fraudulent internal instruction → dual authorisation with segregation of duties; payment limits. Compromised treasury workstation → MFA and privileged access; endpoint detection |
| Consequences and mitigative barriers | Financial loss → bank recall procedure within the recall window; insurance. Customer relationship damage → incident communication plan. Regulatory finding → incident record and reporting procedure |
| Escalation factors | Call-back skipped under time pressure → escalation-factor control: no-exception rule with monitoring. Dual authorisation shared between two people who sit together → periodic review of approver pairs |
| Barrier assessment | Call-back: tested quarterly, effective. Dual authorisation: tested, partially effective (approver pairing). Bank recall: untested — treatment: rehearse with the bank |
What is bow tie analysis?
A risk assessment technique, described in IEC 31010:2019 Annex B among the techniques for analysing controls, that places one top event at the centre of a diagram, its threats and preventive barriers on the left, its consequences and mitigative barriers on the right, and escalation factors and their controls on the barriers.
What are the six elements of a bow tie?
The hazard, the top event, the threats, the consequences, the preventive barriers and the mitigative barriers — with escalation factors and escalation-factor controls as optional additions.
What counts as a barrier?
A control that on its own can stop a threat from causing the top event or limit a consequence after it, with an owner and a test. Policies, awareness and oversight are not barriers; they support or degrade barriers and belong with the escalation factors.
How does a bow tie relate to fault tree and event tree analysis?
It combines the causal left side of a fault tree with the outcome right side of an event tree, dropping the logic gates and probabilities to keep the barriers visible; where quantification is needed, the trees or LOPA are used alongside it.
When should we use bow tie analysis?
For the risks whose controls the organisation most needs to understand — major-accident hazards, critical enterprise risks, significant cyber and operational events — and wherever a board or regulator needs to see what is relied on; one diagram per top event.
Use bow tie analysis for the risks that matter and draw it by the rules: one top event, threats that are sufficient causes, barriers that are real controls with owners and tests, mitigations that act after the event, and escalation factors where the barriers are fragile — then rate the barriers from evidence and read the diagram back into the register and the audit plan, because the bow tie’s value is not the picture but the honest count of what the organisation actually relies on.
The bow tie worksheet and diagram template, the barrier assessment register with owners, tests and effectiveness ratings, and the risk assessment procedure that selects the technique are in the ISO 31000 Risk Management Toolkit, or start with the free templates.


October 11, 2026

October 11, 2026

October 11, 2026
October 11, 2026

October 11, 2026

