BIA impact scoring scales decide whether a business impact analysis produces a defensible ranking of activities or a set of opinions. When one manager rates an outage “high” because it would be annoying and another rates a similar outage “low” because the team could cope, the results cannot be compared, and recovery priorities end up reflecting who argued best. A clear scale removes that problem.
This guide explains how to choose impact categories, define severity levels with real thresholds, express impact over time, calibrate the people who score and convert the results into priorities and recovery time targets. It is general guidance; adapt the numbers to your organization.
Free gap assessment
Would your continuity programme survive an audit?
Score every clause of ISO 22301:2019, free, including the business impact analysis and exercise records most programmes fail on.
ISO 22301 expects an organization to analyse the impact of disruption over time and use the results to set priorities and time frames for resuming activities. A business impact analysis without a consistent scale cannot do this well, because the numbers that come out of workshops are not comparable across departments.
Free business impact analysis
How long can each activity really be down?
Rate the impact of an outage over time, set RTOs and maximum tolerable periods of disruption, map the people, systems and suppliers behind each activity, and get a recovery sequence back, free.
BIA impact scoring scales give everyone the same ruler. They let you compare a payroll process with a customer portal, add up impacts across categories and show leadership why one activity must recover within four hours and another within three days. They also make the analysis repeatable, so next year’s results can be compared with this year’s.
Choose the impact categories for BIA impact scoring scales
Impact categories are the kinds of harm you will measure. Typical choices are financial loss, legal and regulatory consequences, customer impact, reputational damage, operational effect, staff welfare and safety, and environmental harm. Use four to six categories that reflect what your organization actually cares about.
Do not include categories that nobody will assess properly. It is better to score five categories well than eight superficially. Involve finance, legal, operations and communications when you select them so the definitions carry weight. Our guides to financial impact in a BIA and the BIA questionnaire show how categories are used in practice.
Free business continuity risk assessment
What could stop your most important activities?
List your prioritized activities and what they depend on, pick from 32 disruption scenarios, rate them and choose continuity measures for each. Built to ISO 22301 clause 8.2.3, and free.
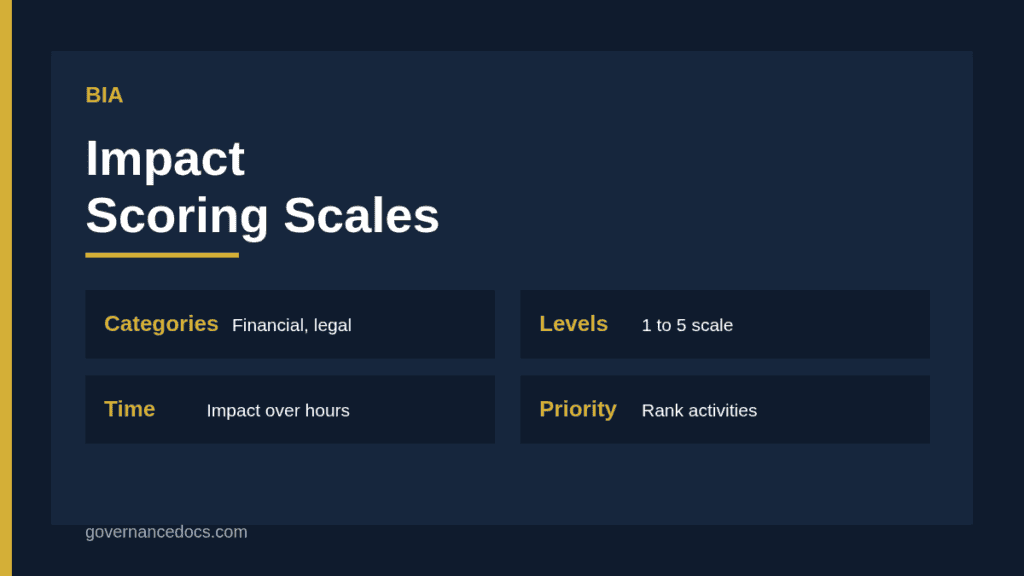
Choose a scale of four or five levels and describe each one for every category with concrete thresholds, as in the table above. Use amounts, durations and observable events rather than words like “high” or “serious”, which mean different things to different people.
Base the financial thresholds on your own size. A loss that is severe for a small company may be trivial for a large one. Link the top level to something that threatens the organization’s survival, such as loss of a licence or a major contract. Get the scale approved by senior management so it has legitimacy when it is used to rank activities.
Level
Financial
Legal or regulatory
Customer or reputation
Safety
1 Minor
Under 10,000
No breach
Few complaints
No injury
2 Moderate
10,000 to 100,000
Minor reportable issue
Noticeable complaints
Minor injury
3 Significant
100,000 to 1 million
Regulator interest
Public criticism
Serious injury
4 Major
1 to 10 million
Formal action
Loss of key customers
Life-threatening
5 Severe
Over 10 million
Licence at risk
Lasting brand damage
Fatality
Score impact over time
Impact grows the longer an activity is unavailable, and the BIA has to capture that. Ask assessors to score each activity at several points, for example one hour, four hours, one day, three days and one week. The point at which the score crosses your unacceptable threshold indicates the maximum time you can tolerate the disruption.
That threshold feeds directly into the recovery time objective and the maximum tolerable period of disruption; see maximum tolerable period of disruption and RTO and RPO for how they relate. Consider timing variations too: month-end, seasonal peaks or regulatory deadlines can change the impact dramatically.
Score at several time points, not once
Use the highest category score at each point
Note peak periods separately
Record assumptions behind each score
Calibrate the scorers using BIA impact scoring scales
Before workshops, run a short calibration exercise. Give all scorers two or three example scenarios and ask them to rate them independently, then discuss differences. This reveals ambiguous wording and personal bias, such as departments that always rate their own work as critical.
Provide a one-page guide with the scale and examples during workshops, and keep a facilitator in the room to challenge inflated ratings. Our page on the BIA workshop explains how to run these sessions so that scores are evidence-based rather than negotiated.
Turn scores into priorities
Aggregate the results into a priority ranking. A common method is to take the highest score across categories at each time point, then rank activities by how quickly they reach an unacceptable level. Activities that hit level four within hours are the most time-critical.
Group activities into tiers with recovery time targets, such as tier one within four hours, tier two within one day and tier three within one week. Check the ranking against dependencies: an activity may need an application or a supplier that has a longer recovery time. See BIA dependencies and BIA application criticality for how to connect them.
Keep the scale consistent with risk assessment
Your BIA scale and your risk assessment scale should not contradict each other. If financial severity levels differ between the two, results will be hard to combine and leaders will be confused. Align the thresholds where possible, and explain any deliberate differences. Our comparison of BIA vs risk assessment shows how the two feed each other.
Review the scale each year, and after major changes in size, strategy or regulation. Thresholds that were sensible three years ago may no longer fit.
Common mistakes with BIA impact scoring scales
Frequent problems include vague level descriptions, scales that are too long or too short, categories nobody understands, scoring at a single point in time, letting each department invent its own scale, no calibration and treating the numbers as more precise than they are. Another is ignoring qualitative impacts because they are harder to score.
Avoid these by using plain thresholds, testing the scale on real examples and reviewing scores for consistency before the results are used. A scale is a tool for judgement, not a replacement for it.
Documenting the scale for audit
Keep the approved scale, its version and the approval date in the continuity management file. Record who scored each activity, when and on what evidence. If an auditor or regulator asks why an activity was placed in a given tier, you can trace the answer from the score back to the thresholds and the people who set them. Update the document whenever the scale changes and keep earlier versions so historic results remain interpretable.
Finally, make the scale easy to use. A one-page reference card, a short training video and a worked example are enough to keep scoring consistent across sites and years.
Handling qualitative and unquantifiable impacts
Not every impact can be turned into a number. Harm to reputation, loss of trust or effects on staff morale resist neat thresholds. Describe them in observable terms instead: media coverage in national outlets, formal complaints from named regulators, loss of a specified number of key accounts. Then map those descriptions to the same one-to-five scale so they can be compared with financial impacts.
Where scorers disagree, ask what evidence would settle the matter, such as past incidents, contract penalty clauses or regulator guidance. Recording the evidence beside each score turns an argument about opinions into a check of facts, and it makes the whole analysis easier to defend later.
A short worked example
A regional bank uses five levels across financial, regulatory, customer and safety categories. For its card authorisation service, the impact is level two after one hour, level three after four hours because of customer complaints and level four after one day because of regulatory reporting duties. The unacceptable threshold, level four, arrives at about one day, so the recovery time objective is set at four hours to leave a safety margin.
For an internal training scheduling tool, impact stays at level one for a week, so it is placed in the lowest tier. The scale made both decisions quick and easy to explain to the board.
A ready structure for the BIA
If you want the scales, questionnaires, dependencies and recovery targets already organised, the Business Impact Analysis Report and Workbook provides a report and workbook designed around a consistent scoring approach, in line with ISO 22301:2019 on business continuity management. Whichever tool you use, sound BIA impact scoring scales rest on clear thresholds, time-based scoring and calibrated scorers.
BIA impact scoring scales FAQ
How many levels should a BIA scale have?
Four or five is usual. Fewer levels lose useful distinctions, and more create false precision and argument over small differences.
Should the scale be the same as the risk assessment scale?
Ideally the thresholds are aligned so results can be combined. If they differ, explain why and make sure the two are not contradictory.
Why score impact over time?
Because impact grows the longer an activity is disrupted. The point at which the score becomes unacceptable helps set recovery time objectives.
Who approves the scale?
Senior management, ideally the same group that approves the continuity policy, so the scale has authority when ranking activities.
How often should we review the scale?
Annually and after major changes in size, strategy, regulation or customer base, so the thresholds still reflect real tolerance.