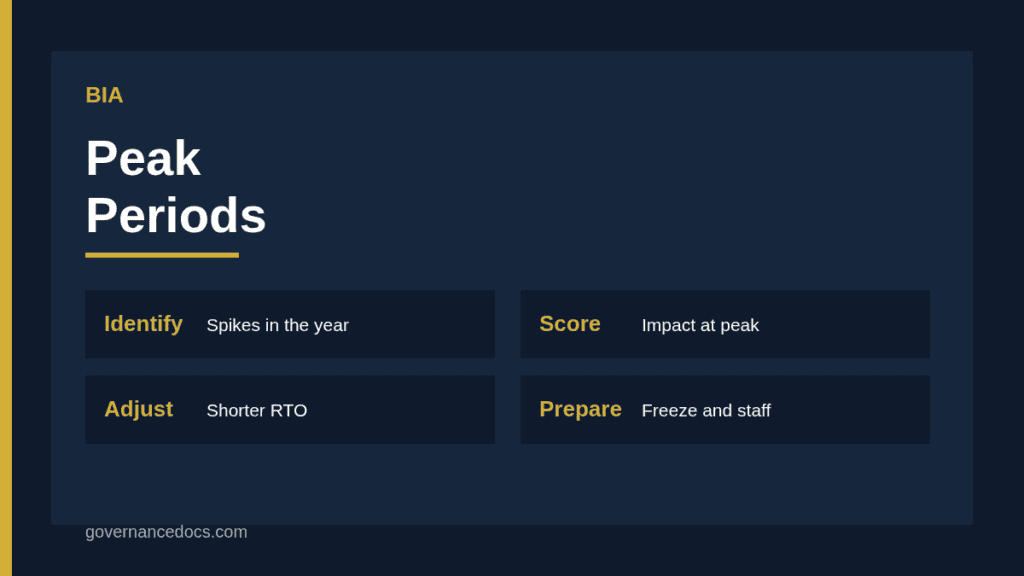
BIA peak periods are the times of year, month or day when losing an activity does the most damage, and they are the most common reason a continuity plan that looked fine on paper fails in practice. A retailer can tolerate a day’s outage in February but not on Black Friday. A finance team can tolerate a payroll system failure on the first of the month but not on payday. A single average impact score hides these spikes.
This guide explains how to identify peak periods, capture them in the analysis, adjust recovery targets, plan resources and test for the worst timing. It is general guidance and should be adapted to the rhythms of your own organization.
Free gap assessment
Would your continuity programme survive an audit?
Score every clause of ISO 22301:2019, free, including the business impact analysis and exercise records most programmes fail on.
A business impact analysis usually asks how bad it would be if an activity stopped for an hour, a day or a week. If people answer for a typical day, the results understate exposure at the worst moments. The recovery time objective then looks generous in the quiet season and dangerously slow in the busy one.
Free business impact analysis
How long can each activity really be down?
Rate the impact of an outage over time, set RTOs and maximum tolerable periods of disruption, map the people, systems and suppliers behind each activity, and get a recovery sequence back, free.
Standards such as ISO 22301 ask you to analyse impact over time and to set priorities and timeframes for resuming activities. Capturing BIA peak periods makes those timeframes realistic, and helps leaders decide when to relax controls, when to add capacity and when to avoid risky changes.
Find your BIA peak periods
Start with the people who run each activity. Ask when the work is busiest, when deadlines fall and when a failure would be hardest to recover from. Look at data to confirm: transaction volumes by day and month, order books, helpdesk tickets, payroll calendars and regulatory calendars.
Record peaks on a simple calendar for the year. Include fixed dates such as tax deadlines, variable dates such as product launches and recurring cycles such as month-end. Do not forget dependencies: an activity may be quiet, but a supplier or system it relies on might be at its peak.
Capture peak impact in the scoring
Extend your scoring so that each activity is rated for both normal and peak conditions. For each, ask how impact grows over one hour, four hours, one day and so on. The peak profile often crosses your unacceptable threshold much sooner than the normal one. Use a consistent scale, as described in BIA impact scoring scales, so normal and peak scores can be compared.
Record the assumptions behind each score, such as the volume of orders per hour or the number of payments waiting. Those details let you check the numbers later and update them when volumes change.
Peak type
Example
Effect on the BIA
Annual seasonal
Holiday retail trading, tax filing season
Higher impact and shorter recovery time in season
Monthly cycle
Month-end close, payroll run
Impact spikes on specific days
Regulatory deadline
Quarterly filing, licence renewal
Fixed dates with legal consequences
Event-driven
Product launch, sporting event, election
One-off, high visibility
Daily pattern
Morning trading open, evening peak in transport
Hour-by-hour variation
Score normal and peak conditions separately
Note the dates or triggers for each peak
Record volumes and assumptions
Identify dependencies that peak at the same time
Adjust recovery targets
The recovery time objective should reflect the most demanding period, or you should define two: a normal target and a peak target. For example, a booking system may have a four-hour RTO in the off-season and a one-hour RTO in the peak. Explain to leaders what each costs.
Compare peak targets with what your infrastructure and suppliers can deliver. A peak target of one hour is meaningless if the supplier’s recovery time is four. Use the reasoning in RTO and RPO and check supplier commitments as described in supplier business continuity assessment.
Plan resources and protections for the peak
Once you know the peaks, plan around them. Options include change freezes before critical periods, extra monitoring, additional staff on call, standby capacity, earlier backups and pre-positioned stock or equipment. Move risky projects, such as major system upgrades, away from the peak.
Communicate the calendar widely. Project teams, IT, procurement and facilities all need to know when a change or maintenance window would be dangerous. A shared calendar of critical periods is a low-cost control that prevents many self-inflicted incidents.
Test BIA peak periods for the worst timing
Exercises should include the peak. Design scenarios that assume the disruption happens on the busiest day, with most staff already stretched. Tabletop exercises are a simple way to explore whether the plan holds up; see business continuity exercises for methods.
Ask what would change. Would you need to invoke the plan faster? Are there staff on leave? Is the fallback able to handle peak volume, or only average volume? Capture the answers and update the plan and the BIA.
Link peaks to risk assessment
Peaks also change the risk picture. A threat that is low-impact in the quiet season may become severe at the peak, such as a severe weather event during holiday trading. Carry the peak into the risk assessment so treatments are prioritised accordingly, and see business continuity risk assessment example for how scenarios are built.
Free business continuity risk assessment
What could stop your most important activities?
List your prioritized activities and what they depend on, pick from 32 disruption scenarios, rate them and choose continuity measures for each. Built to ISO 22301 clause 8.2.3, and free.
Seasonal threats deserve attention too. Winter storms, summer heat, flu season and holiday absences all interact with peaks. Consider them together rather than in isolation.
Common mistakes with BIA peak periods
Frequent errors include scoring only a typical day, ignoring monthly cycles, forgetting dependencies that peak together, setting one RTO for the whole year, testing only in quiet times and failing to share the calendar. Another is treating peaks as fixed when they move, for example as customer behaviour changes.
Avoid these by asking about peaks in every BIA interview, checking data, updating the calendar annually and building peak scenarios into exercises. See the BIA workshop for how to structure the questions.
Communicating peak risk to leaders
Present peak findings in terms leaders care about: revenue at risk in the busiest week, customers affected, penalties that would apply and the cost of protecting the period. A simple chart of impact over time, with normal and peak lines, makes the case clearly. Ask leaders to confirm the peak targets and the funding, and record the decision. If they choose to accept a longer target, that is a legitimate risk decision, but it should be explicit and dated rather than discovered during an incident.
Follow up after each peak: what happened, what nearly went wrong and what should change. Those lessons are the best input for next year’s analysis.
Data sources that reveal peaks
Some peaks are obvious, but others only show up in the numbers. Look at ticket counts, call volumes, payment runs, order intake and system load by day and hour over at least two years. Ask finance for the dates of period-end closes and audits, and ask legal for filing deadlines. Compare these with the calendar from process owners and reconcile any differences. Where data is missing, ask people to estimate and mark the figure as an assumption to be verified next time.
A short worked example
An online ticketing company finds that its booking platform has a normal RTO of four hours. Data shows that ticket releases for major events drive most annual revenue and that a thirty-minute outage during a release causes severe reputational harm. The BIA adds a peak profile with a fifteen-minute tolerance during release windows.
The company schedules a change freeze before each release, adds standby capacity, staffs an on-call team and tests failover under load. It also builds a calendar of releases for planning. The extra effort is confined to the periods that need it, which keeps costs manageable.
Keeping the calendar and the analysis current
Review the peak calendar at least once a year, and whenever the business launches new products, enters new markets or changes its operating model. Update volumes and assumptions, and reassess whether targets still fit.
Add peak awareness to change management: any change request touching a critical activity should show whether it falls near a peak. This keeps the analysis alive in day-to-day decisions rather than sitting in a report.
Structuring the analysis
If you want the activities, scales, peak profiles and recovery targets organised together, the Business Impact Analysis Report and Workbook provides a report and workbook designed for a structured analysis, consistent with ISO 22301:2019 on business continuity management. Whichever tool you use, handling BIA peak periods means asking when it would hurt most, and preparing for that moment.
BIA peak periods FAQ
What are peak periods in a BIA?
Times when disruption would do most harm, such as seasonal trading, month-end, regulatory deadlines or major events. They can push impact past tolerance much sooner than on a normal day.
Should we set different RTOs for peak and normal times?
Often yes. A shorter peak target reflects higher impact, provided the infrastructure and suppliers can deliver it and leaders accept the cost.
How do we find peaks?
Ask process owners and confirm with data such as transaction volumes, payroll and regulatory calendars, and launch schedules.
Do peaks affect suppliers?
Yes. A supplier may be at its own peak when you need it. Check capacity and recovery commitments for the busiest periods.
How often should the peak calendar be reviewed?
At least annually and whenever products, markets or operating models change.