Business continuity risk monitoring is the ongoing tracking of indicators, incidents and changes that show whether your continuity risks are rising, falling or being managed as planned. It stops the risk register from becoming a document that is accurate only on the day it was written.
This guide explains what to monitor, how to set thresholds, how often to review and how to report results. It builds on your risk criteria, risk register and risk treatment plans.
Why business continuity risk monitoring matters
Risks change between reviews. A supplier fails, a system is replaced, a key person leaves or a new threat emerges, and the annual assessment misses it. Monitoring shortens the gap between change and response.
ISO 22301:2019, listed at ISO 22301:2019 on iso.org, expects organizations to monitor, measure, analyse and evaluate their continuity arrangements, so monitoring is a requirement as well as good practice.
What business continuity risk monitoring should cover
Cover three areas: the level of the risks themselves, the health of the controls and plans that reduce them, and the external environment. Examples include recovery test results, supplier condition, incident trends, staff availability and regulatory change.
Choose measures tied to decisions. If nobody would act on a number, it does not belong in the monitoring set.
Choosing indicators for business continuity risk monitoring
Leading indicators change before a disruption, for example a supplier credit warning or a growing backlog of unpatched critical systems. Lagging indicators, such as the number of outages last quarter, confirm what already happened. Use both, but weight towards the leading kind.
The guide to KRI thresholds shows how to set meaningful trigger levels.
Calibrating thresholds with real data
Look at twelve months of history before fixing thresholds. If restore tests failed twice last year, a red threshold of one failure would fire constantly, while a threshold of five would never fire. Set amber close to the upper end of normal variation and red at the point where the business would need to act. Review the levels after each quarter until they settle, and record the reason for every change so the numbers stay defensible.
Where history is short, borrow ranges from industry benchmarks or similar functions and mark them provisional.
Setting thresholds and escalation
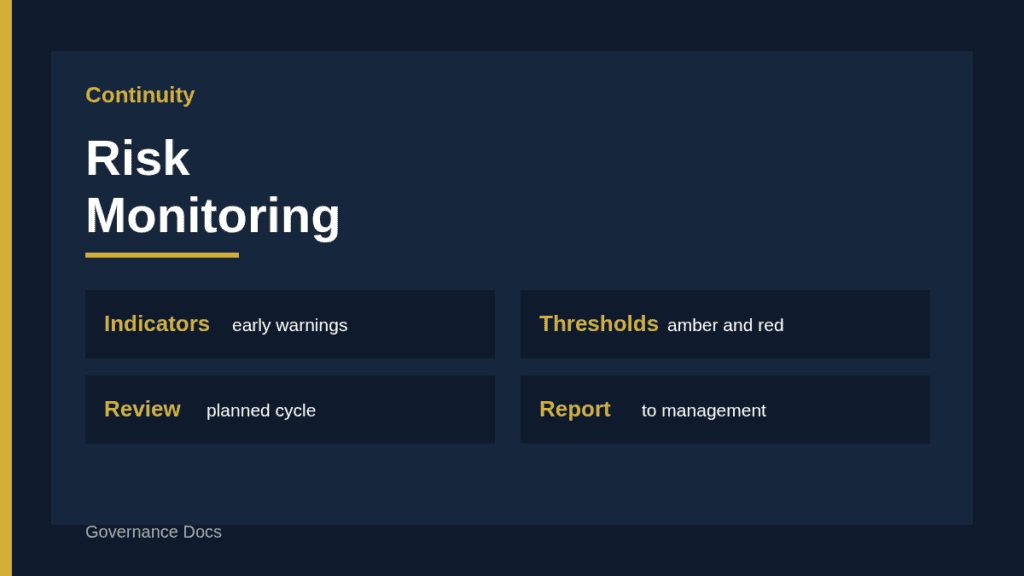
Give each indicator amber and red levels, an owner and an escalation route. Amber prompts a check and possibly a plan, while red requires a decision from senior management. The table below shows sample indicators and levels that you can adapt.
Calibrate thresholds against history so they do not fire constantly or never fire at all.
Indicator
What it signals
Amber
Red
Backup restore test success
Recovery readiness
One failed test
Two failed in a row
Critical supplier financial alerts
Supplier failure risk
Downgrade
Insolvency notice
Overdue continuity actions
Treatment discipline
Over 30 days
Over 90 days
Plan contacts out of date
Ability to mobilize
Over 10 percent
Over 25 percent
Unplanned outages of critical systems
Operational resilience
Two per quarter
Four per quarter
Escalation paths when an indicator turns red
A red indicator should trigger a defined sequence: the owner confirms the data within a day, informs the continuity lead, proposes an action and, if the risk affects a critical activity, alerts the executive sponsor. Document who can approve extra resources or accept the exposure for a defined period. Without that path, red indicators sit unread in a report.
Assigning owners and frequency
Every indicator needs an owner who collects the data and explains movements. Set the frequency by pace of change: monthly for operational measures, quarterly for supplier and staffing, and annually for context. Automate collection where possible so reporting does not depend on manual effort.
Monitoring the effectiveness of plans and tests
Test results are among the best indicators. Track how often exercises are held, how many objectives were met and how many actions were closed. Compare demonstrated recovery times with the objectives explained in the guide to RTO and RPO.
A widening gap between demonstrated and required recovery time is an early warning worth escalating.
Monitoring suppliers and dependencies
Third parties are a growing source of disruption. Watch their financial health, incident notifications, audit results and concentration of critical services in one provider. Our guide to supplier continuity assessment describes the evidence to request.
Review your dependency map when a supplier changes, because new links can create single points of failure.
Data sources for monitoring
Draw indicator data from systems you already run. Incident and outage figures come from service management tools, backup and restore results from operations logs, supplier information from procurement and third-party risk records, and staffing data from HR. External sources include regulator bulletins, threat intelligence, weather warnings and news alerts. Agree who pulls each source and when, and document limitations such as delays or gaps so readers interpret the numbers correctly.
Triggers for an unplanned review
Some events should prompt an immediate reassessment: a major incident, a merger, a new site, a critical system change, a regulatory update or a red indicator. Build the triggers into change management and incident processes so review requests appear automatically.
A sample business continuity risk monitoring dashboard
A useful dashboard fits on one page. The top row shows the number of continuity risks by rating and the change since last period. The middle section lists indicators at amber or red, each with owner, trend and action. The bottom section shows exercise results, overdue actions and decisions requested. Use colour sparingly and always show the number as well, so the reader can tell a marginal amber from a serious one. Add a short commentary of three or four sentences explaining what changed and why. Leaders read short commentary far more often than they open a large spreadsheet.
Store each dashboard with its date so you can show trends and demonstrate to auditors that monitoring took place.
Keeping business continuity risk monitoring proportionate
Small organizations do not need a large indicator set. A handful of measures reviewed monthly by a small group is often enough, provided owners are clear and thresholds trigger action. Larger organizations can layer detail by business unit, but should still roll up to a short executive view. Proportion matters because an overloaded process is quickly abandoned, while a light process that runs every month keeps risks visible and current.
Common mistakes in monitoring
Avoid the usual failings.
Too many indicators, so nobody reads the report.
No thresholds, so numbers carry no meaning.
Indicators without owners.
Reports that never lead to decisions.
Never retiring measures that no longer help.
Involving the business in monitoring
Continuity monitoring works best when process owners take part. Ask each activity owner to confirm every quarter that their dependencies, contacts and workarounds are still valid, and to flag changes such as new tools or suppliers. A short attestation form takes minutes and often catches problems that central teams cannot see. Feed the answers into the register and the indicator set.
Reporting business continuity risk monitoring to management
Give senior management a one-page dashboard: top risks and their trend, indicators at amber or red, overdue actions and decisions needed. A simple risk heat map showing movement since the last period is easy to read. Keep the story short and the requests specific.
Where a change is significant, note it in the management review record too, so leaders see how the risk picture shifted between formal reviews and why particular actions were taken.
Feeding monitoring back into the risk register
When an indicator moves, update the related risk score or note why it stays. Record the date and reason so the register reflects the latest view. Over time, patterns in the monitoring data show which risks are changing fastest and where treatment effort should go.
Auditing the monitoring process
Internal audit can test whether monitoring works by sampling indicators and tracing them from data source to report to decision. Look for missed thresholds, late reports and actions that were never closed. Findings should return to the continuity lead as improvements, completing the cycle of measure, evaluate and improve that the standard describes.
Building the monitoring routine
Keep the routine light: a monthly data pull, a quarterly review meeting and an annual reset of indicators. If you want a ready structure, the Business Continuity Risk Assessment Report and Workbook provides scoring and review fields that support this cycle. Whatever tool you use, keep a dated record of every review as evidence.
Free business continuity risk assessment
What could stop your most important activities?
List your prioritized activities and what they depend on, pick from 32 disruption scenarios, rate them and choose continuity measures for each. Built to ISO 22301 clause 8.2.3, and free.