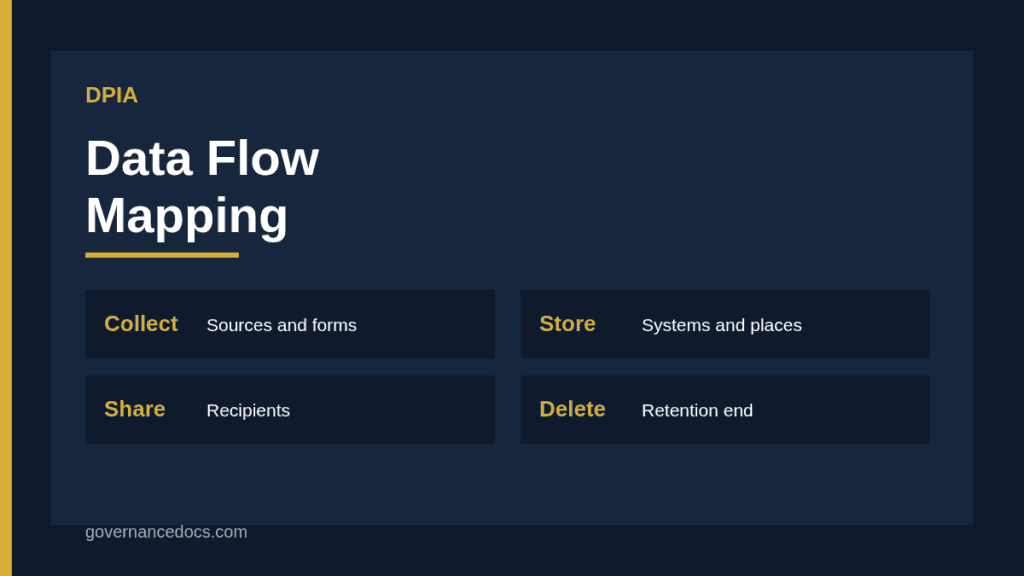
DPIA data flow mapping is the foundation of a sound impact assessment, because you cannot assess risk to people until you know where their data goes. Article 35(7) of the GDPR requires a systematic description of the envisaged processing operations and their purposes, and a clear map of the data flows is the most reliable way to produce that description.
This guide explains what to map, how to gather the information, how to draw the flows at the right level of detail and how to use the finished map to find risks and support your scoring. It is general information, not legal advice.
Why a data flow map comes first
A DPIA that starts with scoring but no map tends to rest on assumptions. The team believes it knows where data goes, but nobody has traced it end to end. Mapping replaces belief with evidence, and it nearly always surprises someone: an old export that still runs, a supplier that receives more data than expected, or a spreadsheet copy on a shared drive.
DPIA data flow mapping also makes the rest of the assessment faster. With a clear picture, the description of processing, the list of recipients, the retention statement and the identification of risk points all follow naturally. It ties closely to GDPR data mapping, and the same map can feed your record of processing.
What to include in the map
At minimum, capture the categories of personal data, the categories of people, the sources, the systems and locations that hold the data, the people and teams who access it, every recipient and processor, any transfers outside your jurisdiction and the point where data is deleted. Add the purpose and the lawful basis for each stage so that the map explains why each flow exists.
Keep the focus on the processing under assessment. It is tempting to map the whole organization, but a DPIA map covers one project or system. Draw a boundary and note what is outside it. If flows leave the boundary, follow them as far as the first recipient and record how they are governed.
Stage
Questions to ask
Risks it can reveal
Collection
What data, from whom, by what means?
Over-collection, unclear notice
Storage
Which systems and locations hold it?
Weak access controls, shadow copies
Use
Who uses it and for what?
Purpose creep, profiling
Sharing
Which processors and recipients receive it?
Uncontrolled onward transfer
Transfer
Does it leave the country or region?
Unlawful transfer, foreign access
Deletion
When and how is it removed?
Over-retention, incomplete erasure
Free DPIA template and tool
Does this processing need a DPIA, and what would it say?
Screen the processing against Article 35 and the nine WP248 criteria, describe it, test necessity and proportionality, rate the risks to the people concerned and record the DPO's advice and sign-off. Free, with findings and the Article 36 check.
How to gather the information for DPIA data flow mapping
Talk to the people who run the process rather than relying on documents alone. Interview the product owner, the developers, operations, security and anyone in the business who uses the data. Ask them to walk through a real example record from the moment it is created to the moment it is deleted. Then compare their account with system documentation, architecture diagrams, contracts and the existing record of processing.
Discrepancies are the valuable part. If the architecture diagram shows one database and the team mentions three, find out why. Record open questions and close them before you finalise the DPIA. Workshops with several teams in the room often reveal gaps faster than separate interviews.
Drawing DPIA data flow mapping diagrams
Use a simple diagram: boxes for systems and parties, arrows for flows, and labels that say what data moves and why. Colour or mark flows that cross a boundary, involve special category data or leave the country. Number the flows so that the risk section can refer to them.
Do not aim for a technical masterpiece. The map has to be understood by the DPO, legal and business owners as well as engineers. A one-page diagram with a supporting table of flows usually beats a complex system architecture. Store it with the DPIA and version it when the processing changes.
Label each arrow with the data and the purpose
Mark cross-border flows and processors clearly
Number flows so risks can refer to them
Date and version the diagram
Using the map to find risks
Walk along each flow and ask what could go wrong. At collection: are people told, and is more collected than needed? At storage: who can access it and is it protected? At sharing: does the recipient have a contract and appropriate security? At transfer: is a lawful mechanism in place and has the destination country been assessed? At deletion: does it really happen, including in backups and at processors?
Write each risk against the flow number, then rate it using your scoring method, for example the approach in DPIA risk scoring. Mapping the risk to a specific flow makes mitigation concrete: you know which arrow needs a control.
Special points: processors, transfers and children
Processors deserve extra attention because data often leaves your direct control. Confirm each one, what it receives and whether its own sub-processors are involved. For transfers, follow guidance such as that in international data transfers and ensure the destination is covered by a valid mechanism.
If the data subjects include children, note how age is established and how parental involvement works, as discussed in DPIAs for children’s data. If the flows involve cameras or sensors, see CCTV DPIAs for specific issues such as signage and retention.
Keeping your DPIA data flow mapping current
A map drawn once and never updated becomes misleading. Tie updates to change management: any new integration, supplier, data field or destination should prompt an update. Review the map during each scheduled DPIA review, as described in DPIA review and monitoring, and compare it with what the systems actually do.
Where possible, use technical evidence to check the map: system inventories, network logs, data catalogue outputs or supplier lists. Automated discovery tools can help, but a human still needs to confirm purpose and lawful basis. Treat any unexplained flow as a finding until it is explained.
Common mistakes in DPIA data flow mapping
Common problems are mapping only the happy path, forgetting backups and logs, ignoring manual processes such as emailed spreadsheets, overlooking processors’ sub-processors and drawing flows at a level so high that risks vanish. Another is mapping without the business, so the diagram reflects what IT built rather than what people do.
Avoid these by tracing real examples, asking what happens when something fails, and checking that every recipient in the diagram appears in a contract and in the record of processing. A wrong map is worse than no map, because it gives false comfort.
Who should sign off the map
Before the map goes into the assessment, ask the process owner and the lead engineer to confirm in writing that it matches reality. Ask the DPO to review it for missing recipients, transfers and special category data. A short sign-off, dated and attached to the DPIA, makes the map a controlled document rather than a sketch and shows that the description of processing was verified. If the review turns up corrections, record them so the final version can be traced back through its earlier drafts.
A short worked example
A healthcare provider plans an app for appointment reminders. The map shows patient details collected at registration, stored in a scheduling system, passed to an SMS provider and to an analytics service, and deleted after two years. Walking the flows reveals that the analytics service receives full names although it only needs anonymous counts, and that the SMS provider stores messages in another country.
The team removes names from the analytics feed, adds a transfer safeguard for the SMS provider and shortens retention of message logs. All three fixes come straight from the map, and each is recorded as a mitigation with an owner. The assessment is faster to finish and much easier to defend.
Using a ready structure for the DPIA
Once the map is complete, you need a report that carries it, the risks, the measures and the sign-off. The DPIA Report and Workbook provides a structured layout for that, aligned with Article 35 of the GDPR, so the map feeds directly into the systematic description the regulation expects. Whichever tool you use, good DPIA data flow mapping turns the assessment from guesswork into a traceable analysis.
DPIA data flow mapping FAQ
Is a data flow map mandatory for a DPIA?
The GDPR requires a systematic description of the processing, and a data flow map is the most practical way to meet that requirement, though the format is up to you.
How detailed should the map be?
Detailed enough to show every system, recipient, transfer and deletion point relevant to the processing, but simple enough for non-technical reviewers to follow.
Can we reuse the map from our ROPA?
Yes, as a starting point. The record of processing is usually higher level, so add the flow detail a DPIA needs and check that the two stay consistent.
Who should draw the map?
The project or product owner, with input from IT, security, the DPO and the business teams who use the data. Workshops with several people work well.
How do we keep the map up to date?
Link it to change management, review it at every scheduled DPIA review and check it against system inventories and supplier lists.