Data governance metrics are how a governance programme shows it is working. Without them, governance looks like meetings, policies and committees, and it is the first thing cut when budgets tighten. With well-chosen metrics, a programme can show that data is more reliable, that people follow the rules, that risks are falling and that the business gets value from the effort.
This guide explains which data governance metrics to track, how to define them, how to avoid common traps and how to report them to leaders in a way that supports decisions.
Free gap assessment
How mature is your data management, area by area?
Score all eleven DAMA knowledge areas, free, plus the ethics, AI and organisational change chapters that sit off the wheel.
Governance is an enabling function. Its results are often indirect: fewer disputes about which report is right, fewer incidents, faster onboarding of new data, easier audits. Those benefits are real but hard to see unless they are measured. The DAMA Data Management Body of Knowledge treats measurement as part of managing data, and describes governance as the exercise of authority and control over data assets; see the DAMA body of knowledge overview. Metrics turn that authority into evidence.
They also guide the programme itself. If stewards are appointed but never resolve an issue, the metrics will show it. If a policy exists but nobody follows it, that will be visible too. Our overview of the data governance framework explains how metrics fit into the wider structure.
Categories of data governance metrics
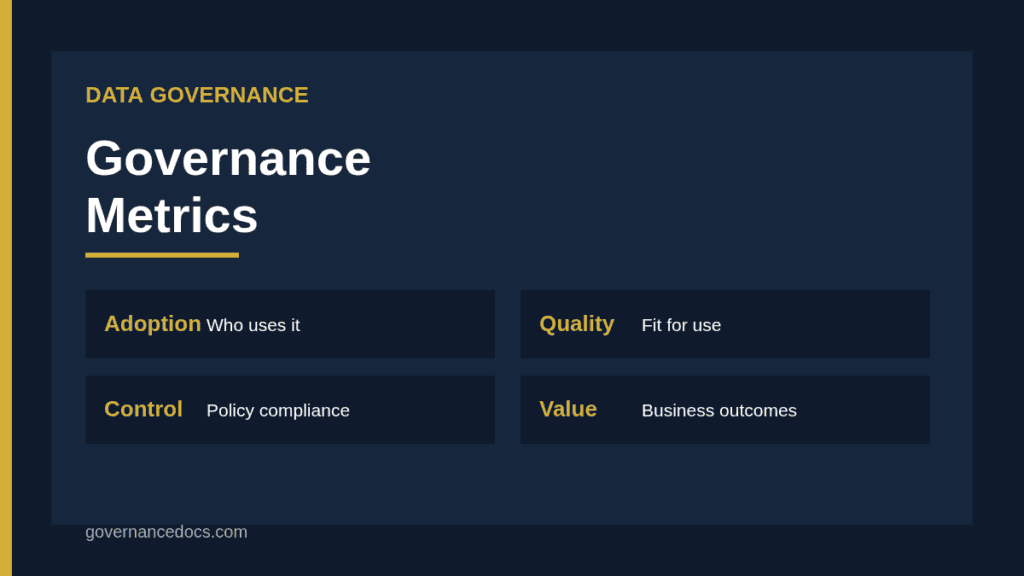
Group your measures so that leaders can see how the programme works as a whole. Five categories cover most needs.
Category
Question it answers
Example metrics
Adoption
Is governance being used?
Critical datasets with a named owner; stewards active; catalogue coverage
Data quality
Is data fit for use?
Completeness, accuracy, timeliness, duplicates in critical data
Policy and control
Are the rules followed?
Access reviews done on time; retention rules applied; exceptions open
Issue management
Are problems resolved?
Issues raised, time to resolve, repeat issues
Business value
Does it matter to the organisation?
Time saved, incidents avoided, reports reconciled, audit findings
Adoption data governance metrics
Adoption metrics show whether the structure exists in practice. Useful examples include the percentage of critical data domains with an assigned owner and steward, the number of stewards who have completed training, the proportion of critical datasets recorded in the catalogue with a definition, and attendance at governance council meetings. The roles are described in our guides to the data governance council and the data steward. Low adoption early in a programme is normal, so treat these as progress measures and set targets that rise over time.
Data quality as part of data governance metrics
Governance does not fix data itself, but it sets standards and accountability for quality. Measure quality on the data that matters most, using clearly defined dimensions such as completeness, accuracy, validity, consistency, uniqueness and timeliness. Our guide to data quality dimensions defines them. For each critical data element, agree a target and a way of measuring it, such as the share of customer records with a valid email address or the number of duplicate supplier accounts.
Trend matters more than a single figure. A score of 92 per cent complete may be good or bad depending on the last three months and the tolerance of the process that uses it. Publish targets with the metric and record who is accountable for improvement.
Policy and control metrics
These show whether the rules work. Examples include the percentage of access reviews completed on schedule for sensitive data, the number of datasets held beyond their retention period, the number of policy exceptions granted and still open, the share of new data projects that passed a governance review before launch, and the number of data incidents linked to a policy breach. Count exceptions carefully. A rising number can mean policies are unrealistic, or that governance is being bypassed.
Issue management metrics
Every programme receives issues: conflicting definitions, quality failures, access disputes, unclear ownership. Track the number raised, the number resolved, the time to resolve by severity, the number that repeat and the number escalated to the council. A healthy programme sees issues raised early and resolved quickly. A programme where nobody raises issues is not necessarily perfect; it may be one nobody trusts.
Business value metrics
Value is the hardest to measure and the most persuasive. Choose a few outcomes that leaders care about, such as reduced time spent reconciling reports, fewer customer complaints caused by wrong data, faster response to regulatory requests, shorter onboarding time for new data sources or fewer audit findings related to data. Where possible, translate results into hours saved, costs avoided or risks reduced. Use estimates with stated assumptions, and be honest about what governance caused as opposed to what would have happened anyway.
Choosing the right data governance metrics
A long list is easy to produce and hard to act on. Select a small set, perhaps eight to twelve, that meet these tests.
Relevant. Linked to a goal of the programme or the business.
Defined. Clear formula, data source, owner and frequency.
Measurable. Available without unreasonable manual effort.
Actionable. Someone can do something when the number moves.
Stable. Comparable from period to period.
Write each metric in a short definition sheet with its purpose, calculation, data source, owner, target, thresholds and reporting audience. It stops arguments about what the number means and lets a new owner take over without losing the thread.
Setting targets and thresholds
Set a target and thresholds for action, such as green, amber and red. Base the first targets on a baseline measured before any improvement effort, then raise them as the programme matures. Where a metric sits in red for two periods in a row, it should trigger a discussion at the council about cause and response. Our maturity guidance in the data governance maturity model helps you decide how demanding targets should be at each stage.
A hypothetical example of data governance metrics
The following is a hypothetical example invented for illustration. A retailer launches data governance with a focus on customer and product data. In the first year it tracks ten metrics. Adoption: 80 per cent of critical data elements have an owner by month six. Quality: valid email addresses in the customer master rise from 84 to 93 per cent, and duplicate product codes fall by half. Control: access reviews for customer data complete on time in every quarter. Issues: median time to resolve a definition dispute falls from 40 to 12 days. Value: the finance team reports saving about 30 hours a month by no longer reconciling two versions of sales.
The council reviews the dashboard quarterly. When duplicate supplier accounts stay red for two quarters, it funds a cleanup and adds a check at account creation. The metrics did not just report the programme; they changed what it did.
Reporting data governance metrics to leaders
Leaders need a one-page summary: the five to eight measures that matter, their trend, the status against target, and the decisions required. Lead with the outcomes, such as quality of critical data and business value, then show adoption and control measures as the reasons behind them. Explain movements in plain terms and avoid technical jargon. Keep detailed definitions available on request. A short story, such as one incident prevented or one decision made faster because data was trusted, makes numbers memorable.
Common mistakes with data governance metrics
Common problems include measuring activity, such as number of meetings, instead of outcomes, choosing too many metrics, using vague definitions, having no baseline, setting targets without evidence, reporting numbers with no owner, ignoring trends, hiding bad news and never retiring a metric that no longer helps. Another is measuring quality across all data instead of the elements that matter most, which drowns real problems in noise.
Keeping the metrics current
Review the metric set each year. Retire measures that have reached target and stay there, and add new ones as the programme extends to new domains. Check that data sources remain reliable, and that definitions still match how data is used. As governance matures, shift from adoption metrics towards value and risk. If you are also comparing your position against a framework, our master data management vs data governance guide shows where the metrics of each discipline differ.
Templates for data governance metrics
Standard templates save time and keep reporting consistent. The Data Governance Toolkit provides policies, roles, registers and reporting templates that you can adapt when setting up your own measures. Whatever format you choose, keep the same layout across reporting periods so that trends are easy to see.
Data governance metrics FAQ
How many data governance metrics should we track?
Most programmes do well with eight to twelve measures across adoption, quality, control, issues and value. More than that is hard to act on and to keep accurate.
What is the best first metric?
The share of critical data elements or domains with a named owner and steward. It is simple, it shows whether accountability exists and it drives the rest of the work.
How do we prove business value?
Pick a few outcomes leaders care about, such as time saved or incidents avoided, estimate them with stated assumptions and show the trend. Be clear about what governance contributed.
Who should own the metrics?
Each metric needs an owner who is accountable for the number, often a data owner or steward, with the governance office responsible for collection and reporting.
How often should we report?
Operational measures monthly, and a summary to the governance council and leaders quarterly. Review the metric set itself annually.