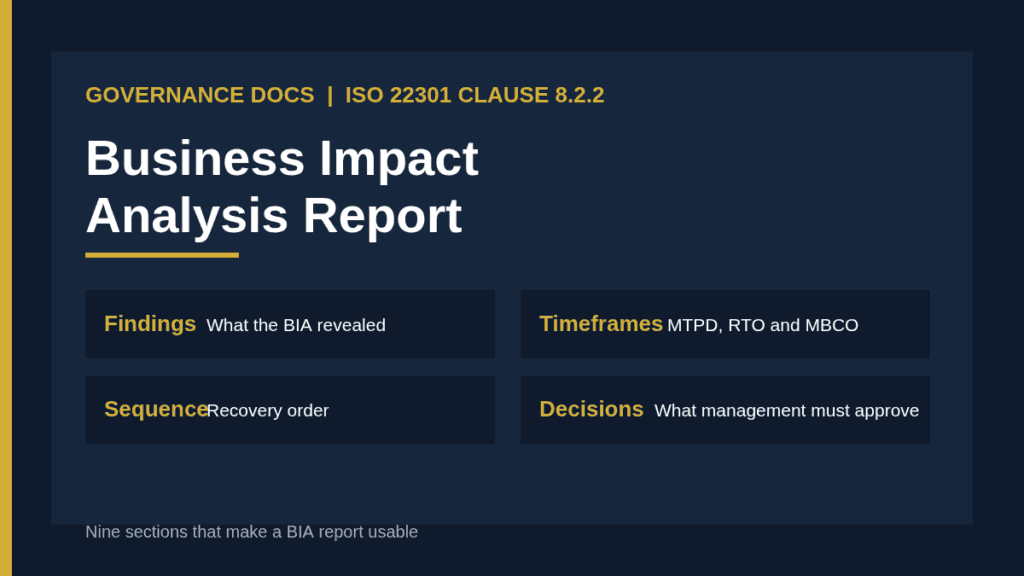
A business impact analysis report is the document that turns weeks of interviews and spreadsheets into decisions management can actually make. The analysis itself, required by clause 8.2.2 of ISO 22301:2019, determines which activities matter most, how quickly they must resume and what they depend on. The report is how you communicate those results, and a poor one leaves a good analysis unused.
This guide sets out what the report must contain, a nine-section structure that works for both auditors and executives, how to write findings that prompt action, and the mistakes that make a report gather dust.
Free gap assessment
Would your continuity programme survive an audit?
Score every clause of ISO 22301:2019, free, including the business impact analysis and exercise records most programmes fail on.
What a business impact analysis report has to show
ISO 22301 asks you to run a systematic business impact analysis. In practical terms that means defining the types of impact and criteria you care about, identifying the activities behind your products and services, assessing how impact grows over time when each activity stops, and finding the point at which that impact becomes unacceptable. You then set prioritized timeframes for resuming activities, identify the resources they need, and map their dependencies, including partners and suppliers.
Free business impact analysis
How long can each activity really be down?
Rate the impact of an outage over time, set RTOs and maximum tolerable periods of disruption, map the people, systems and suppliers behind each activity, and get a recovery sequence back, free.
The business impact analysis report has to make each of those steps visible. An auditor should be able to trace from your criteria to your ratings to your recovery timeframes without asking anyone to explain. An executive should be able to see, on the first page, which activities are most critical, where recovery targets are not currently achievable and what you need them to decide. Our guide to ISO 22301 business impact analysis covers the method, and this article covers the write-up.
The 9 sections of a business impact analysis report
#
Section
Purpose
1
Executive summary
Top findings, gaps against targets and decisions needed
2
Scope and method
Which products, services and units were covered, and how
3
Impact criteria
The impact types and scales used to rate disruption
4
Activity inventory
Activities that support products and services, with owners
5
Impact over time
How severity grows as each activity stays down
6
Recovery timeframes
Maximum tolerable period of disruption, recovery time objective and minimum capacity
7
Resources and dependencies
People, technology, premises, information and suppliers required
8
Recovery sequence and gaps
The order of restoration and where current capability falls short
9
Recommendations and approvals
Actions, owners, dates and sign-off
Sections 1 and 2: lead with the answer
Put the executive summary first and keep it to a page. State how many activities were assessed, which are the most time-critical, where your current recovery capability falls short of the required timeframe and what you are asking management to approve. Executives read this section and little else, so every important message must appear here. Scope and method follow, describing which business units and services were included, how interviews or workshops were run and who took part, so readers can judge how much weight the results deserve.
Sections 3 to 5: show your working
Set out your impact criteria before any results. Readers need to know what a “high” financial impact or a “severe” regulatory impact means in your context, otherwise the ratings look arbitrary. Then list the activities with owners, and show how impact changes over time. A simple grid with time bands across the top, such as first hour, four hours, one day, three days and one week, and impact levels in the cells, tells the story at a glance and shows exactly where the impact becomes unacceptable.
Sections 6 to 8: the numbers that drive planning
This is the core of the business impact analysis report. For each prioritized activity record the maximum tolerable period of disruption, the recovery time objective within it and the minimum level of operation you need on resumption. If you use recovery point objectives for data, include them here and refer to our guide on RTO and RPO for the definitions. Then list the resources each activity needs and the dependencies behind it, because a recovery time objective is meaningless if the supplier or system beneath it cannot recover as fast.
Present the recovery sequence as an ordered list, and add a gap column that compares the target with what current arrangements can achieve. A recovery time objective of four hours against a backup process that takes a day is a finding, and this is where it should appear.
A worked row from the recovery timeframes table
To make the numbers concrete, imagine an activity called “process customer payments”. Its impact grows quickly: negligible in the first hour, moderate after four hours because settlement cut-offs are missed, and severe after one day because of regulatory reporting and customer harm. The maximum tolerable period of disruption is therefore set at one day, and the recovery time objective is set at four hours to leave a safety margin. The minimum operating level is fifty percent of normal transaction volume, because the activity can run in reduced form while full capacity is rebuilt.
Next to those figures the report lists the resources: the payment platform, two named operators, the connection to the settlement bank and a card processing supplier. The gap column then records that the platform recovers in about eight hours today, which is twice the objective. That single row produces a finding, a recommendation and a budget request without any additional explanation.
Tailor the level of detail to the reader
Different readers need different depths from the same analysis. Executives need the summary, the gaps and the decisions. Activity owners need their own rows and the reasoning behind their ratings so they can challenge them. Continuity planners need the resources, dependencies and sequence in full because they will build strategies from them. Auditors need the criteria, method and evidence trail. Structure the document so each group can find its part quickly, with the summary at the front and the detailed tables in appendices.
Free business continuity risk assessment
What could stop your most important activities?
List your prioritized activities and what they depend on, pick from 32 disruption scenarios, rate them and choose continuity measures for each. Built to ISO 22301 clause 8.2.3, and free.
A finding should state the situation, the consequence and the recommendation in plain language. Compare two versions. The weak one says the payment system has no documented recovery procedure. The strong one says the payment system must resume within four hours, no tested procedure exists, and a failure today would breach settlement deadlines within six hours; the report recommends a documented and tested recovery procedure owned by the head of operations within ninety days.
Keep each finding to a few sentences, rate it, and give it an owner and a date. Group findings by theme, such as single points of failure, supplier dependence and untested recovery, so leaders can see patterns instead of a long list. Our worked business impact analysis example shows a finished set of findings for reference.
Getting the report approved and used
The last section should ask for specific decisions: approve the recovery timeframes, fund named gaps, accept residual risks knowingly and confirm the review cycle. Record the approver and the date, because ISO 22301 expects management commitment to be demonstrable. Circulate the report to activity owners before the meeting so nobody sees their own rating for the first time in front of the executive team.
Then feed the results forward. The timeframes drive your continuity strategies and plans, and the dependencies feed your risk assessment. If you have not linked the two, read our comparison of BIA and risk assessment. For the standard itself, see the ISO 22301 page on iso.org.
Common mistakes in a business impact analysis report
Burying the summary. If the key message is on page nine, executives will miss it.
No impact criteria. Ratings without definitions cannot be defended.
Timeframes without dependencies. A target means nothing if a supplier cannot meet it.
Findings with no owner or date. These are observations, not actions.
Interview notes pasted in. Synthesize; do not transcribe.
One-off report. Update it after significant change and on a fixed cycle.
Start from a finished business impact analysis report
The Business Impact Analysis Report and Workbook gives you a ready structure covering the recovery sequence, findings and a live workbook you can populate with your own activities. If you would rather build your own, use the nine sections above and keep the same layout every time you refresh the analysis.
Business impact analysis report FAQ
How long should a business impact analysis report be?
Length depends on scope, but the executive summary should fit on one page and the full report should be as short as the evidence allows. Put detail in appendices so the main body stays readable.
Who should approve the report?
Top management or a delegated senior committee should approve the timeframes and accept residual risk, because those decisions commit resources and set the recovery targets for your plans.
How often should the BIA report be updated?
Update it after significant changes to services, systems, suppliers or structure, and review it on a fixed cycle. Annual review is a common baseline.
What is the difference between the BIA and the BIA report?
The BIA is the analysis process. The business impact analysis report is the record of its results, written so that management can decide and auditors can verify.