The business impact analysis financial impact estimate is often the most argued-over number in continuity planning. Executives want to know what an outage would cost, teams struggle to produce a credible figure, and the result decides how much is spent on recovery. A weak estimate leads to under-investment in critical services or over-investment in unimportant ones.
This guide explains how to estimate business impact analysis financial impact in a way that is defensible: which costs to include, how to show impact growing over time, how to handle uncertainty and how to present the results.
What the standard expects from a BIA
ISO 22301:2019 requires a business impact analysis process that evaluates the impacts over time of disrupting activities, sets prioritised timeframes for resuming them and identifies the dependencies that support them. It does not prescribe currency figures; impacts can be financial, legal, reputational, operational or harm to people. The standard’s listing is on iso.org. Financial estimates are a common way to put the impacts on one scale. Our overview of the ISO 22301 business impact analysis shows where the estimate fits in the whole process.
Free business impact analysis
How long can each activity really be down?
Rate the impact of an outage over time, set RTOs and maximum tolerable periods of disruption, map the people, systems and suppliers behind each activity, and get a recovery sequence back, free.
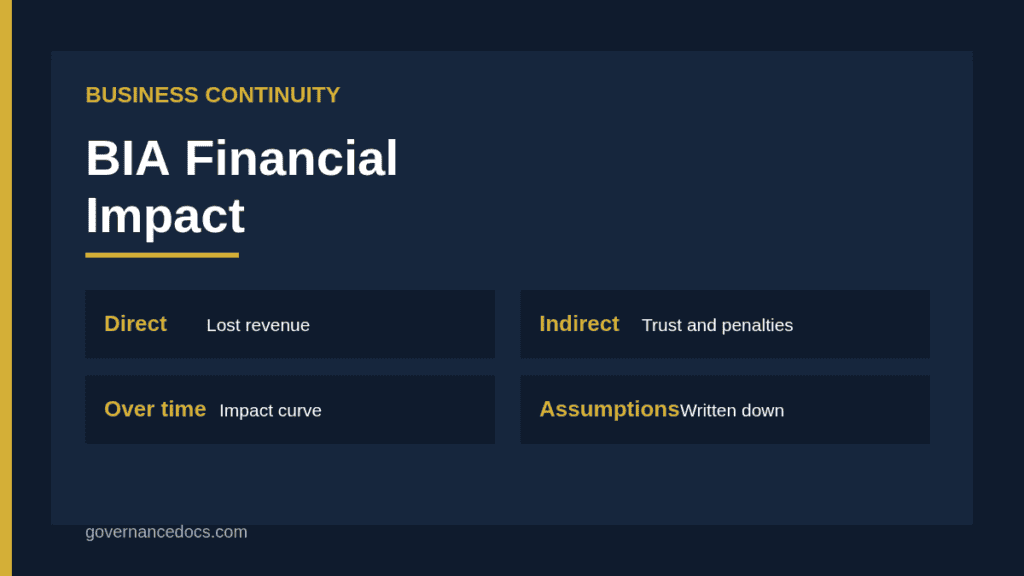
Idle costs. Wages and fixed costs that continue while output stops.
Penalties. Contractual service credits and late-delivery charges.
Free business continuity risk assessment
What could stop your most important activities?
List your prioritized activities and what they depend on, pick from 32 disruption scenarios, rate them and choose continuity measures for each. Built to ISO 22301 clause 8.2.3, and free.
Indirect costs in the business impact analysis financial impact
Indirect costs are harder to measure and often larger. They include customer churn, loss of future orders, reputational damage, regulatory fines, higher insurance premiums, share price effects and reduced staff morale. Estimate these using ranges and clearly state the assumptions. For instance, if a past outage led to two per cent of customers leaving within three months, you can use that observed figure as a starting point, while noting that the sample is small.
Do not omit indirect costs because they are uncertain. A figure with a clear range and reasoning is more useful than a precise-looking number that covers only direct losses.
Show the business impact analysis financial impact over time
The most important feature of a BIA estimate is that impact grows as the disruption continues. A one-hour outage may cost little; a week may threaten the company. Record the impact at defined points, such as one hour, four hours, one day, three days, one week and two weeks. The point at which the impact becomes unacceptable helps determine the maximum tolerable period of disruption. Our guide to RTO and RPO explains how recovery targets follow from it.
Time of outage
Example impact
Typical notes
1 hour
Minor delays, low cost
Mostly absorbed by staff
1 day
Lost sales, service credits
Backlog starts to build
3 days
Customer complaints, contract breaches
Some customers move away
1 week
Significant revenue loss, possible regulatory action
Impact may be hard to reverse
Do not assume impact is linear. Some activities have a cliff: nothing happens for a day, then a regulatory deadline passes and penalties apply. Others have seasonal peaks where an hour of downtime in December costs more than a week in February. Capture those patterns explicitly.
Gathering the numbers for the business impact analysis financial impact
Use several sources. Finance can supply revenue by product, cost of labour and contractual penalties. Operations can explain how long work can be delayed before harm results. Sales and customer teams can describe the customers most likely to leave. Past incidents, including near misses, offer real evidence. Interview the owners of each critical activity using a consistent form; our business impact analysis questionnaire guide provides questions you can adapt.
Write down assumptions
For every figure, record where it came from and what was assumed: the period used for revenue, the share of sales recoverable after the outage, the number of staff affected. A reviewer should be able to change an assumption and see the result move. Undocumented figures cannot be defended when challenged, and they cannot be updated sensibly a year later.
Use ranges, not false precision
Present a low, expected and high estimate where you can. Ranges show honest uncertainty and let leaders see the downside. A single figure such as 1,254,300 gives an impression of accuracy that the inputs do not support.
Common data sources and how to sanity-check them
Sanity checks stop errors from spreading. Compare the revenue attributed to an activity with the finance ledger, and check that the sum of all activities does not exceed total revenue. Compare staffing figures with the payroll headcount. Ask an owner to describe the last real disruption and check whether your model would have predicted its cost. Where the numbers disagree by a wide margin, find out why before the report goes to leaders.
Watch for double counting. Lost revenue for a product and lost revenue for the service that supports it are often the same money, counted twice. Assign each cost to one activity and note any shared costs separately. A clean allocation makes the ranking of critical activities fairer and the total more credible.
Reviewing the estimate with finance
Ask a finance partner to review the method and a sample of the figures before you publish. Their sign-off adds credibility, and their questions usually expose weak assumptions. Record the reviewer and the date next to the estimate.
Non-financial impacts still matter
Money is not the only scale. Some impacts, such as risk to safety, breach of legal duty or harm to vulnerable customers, are unacceptable at any price. Record them in a separate column with their own scale. A short outage of a healthcare service, for example, may cost little in revenue but create serious risks to patients. Where a non-financial impact reaches an unacceptable level earlier than the financial one, it sets the recovery target. See our comparison of BIA and risk assessment for how impact analysis differs from assessing threats.
A hypothetical example of business impact analysis financial impact
The following is a hypothetical example invented for illustration. A regional insurer analyses its claims-intake activity. Finance reports that the service handles about 400 claims a day, and each handled claim carries an average processing cost of 45 currency units. During an outage, staff can log claims by phone on paper for about a day at half speed, so direct losses in the first day are small and mainly overtime.
After two days, the backlog breaches regulatory time limits for acknowledging claims, so penalties begin. After three days, complaints rise and the insurer estimates one per cent of affected customers may leave, with a range of half to two per cent. The analysis records low, expected and high figures at each point, notes the regulatory deadline as a cliff, and concludes that the maximum tolerable period is two days and the recovery target should be four hours to leave a margin. These figures justify funding a failover system that a bare description of risk did not.
Presenting business impact analysis financial impact to leaders
Keep the presentation simple: a ranked list of critical activities, the impact at key time points, the maximum tolerable period, and the gap between the current recovery capability and the target. A chart of impact rising over time is more persuasive than a table. Highlight the decisions you need: which gaps to fund, which to accept, and who owns the actions. Make the assumptions available on request, not on the first slide.
Common mistakes in business impact analysis financial impact
Common weaknesses include counting only lost revenue, ignoring indirect costs, treating impact as linear, forgetting penalties and cliffs, using annual figures for a short outage without adjustment, failing to record assumptions, relying on one interview, and never refreshing the numbers. Another is asking each department to estimate its own importance, which tends to inflate all of them. Use consistent scales and challenge results with finance.
Keeping business impact analysis financial impact current
Update the numbers when revenue, contracts, processes or systems change, and at least once a year. After any real incident, compare actual costs with the estimate and adjust the method. Recording that comparison is powerful evidence for auditors that the process learns from experience. See our business impact analysis example for a complete record.
A structured report for business impact analysis financial impact
A consistent report format helps you record activities, impacts over time, dependencies and recovery targets in the same way for each area. The Business Impact Analysis Report and Workbook provides a report and workbook for documenting these findings. Whichever tool you use, keep the same structure across activities so leaders can compare and rank them.
Business impact analysis financial impact FAQ
Does ISO 22301 require a financial estimate?
The standard requires evaluation of impacts over time but does not require currency figures. Many organisations use financial estimates alongside other impact types because they make comparison easier.
How do we estimate indirect costs?
Use past incidents, customer data and ranges with stated assumptions. Even a rough range is more useful than leaving indirect impacts out.
Should impact be shown as one number?
Better to show it at several time points, with low, expected and high values. A single number hides how quickly impact grows and how uncertain it is.
Who provides the figures?
Finance, operations, sales and customer teams each supply part. The BIA owner collects them with a consistent form and challenges outliers.
How often should the estimates be updated?
At least annually, and when the business, contracts or systems change significantly, and after any real incident to compare the estimate with the actual cost.