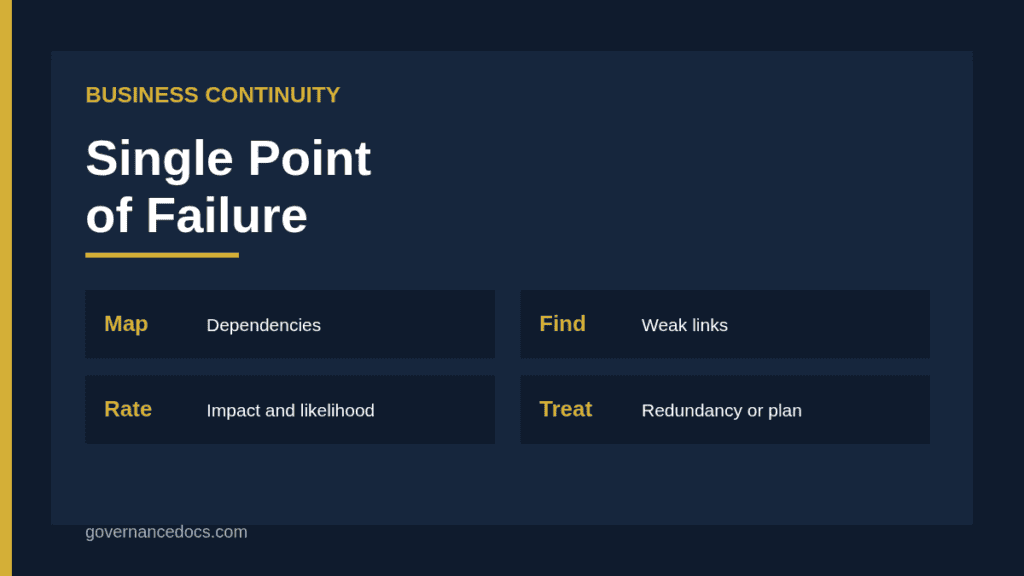
Single point of failure analysis is one of the most useful and least glamorous parts of a business continuity risk assessment. It asks a plain question about each critical service: what one thing, if lost, would stop it? The answer might be a person who holds the only knowledge of a process, a server with no replica, a supplier with no alternative or a single network link. Finding these weak links before they fail is far cheaper than discovering them during an outage.
This guide explains how to carry out single point of failure analysis: how to map dependencies, how to spot weak points, how to rate them and how to record the results so they drive action.
Why single point of failure analysis belongs in continuity planning
ISO 22301:2019 requires an organisation to have a process for systematically identifying, analysing and evaluating the risk of disruptive incidents, and to determine which risks need treatment. You can read the standard’s listing on iso.org. A business impact analysis identifies which activities matter most and how quickly they must recover. Single point of failure analysis then examines what those activities depend on, and where one loss would bring them down. See our guide to the ISO 22301 risk assessment for the wider process.
Free business impact analysis
How long can each activity really be down?
Rate the impact of an outage over time, set RTOs and maximum tolerable periods of disruption, map the people, systems and suppliers behind each activity, and get a recovery sequence back, free.
The technique is valuable because it is simple to explain and does not depend on predicting exactly what will cause a disruption. Whether the trigger is a fire, a cyber attack or a resignation, the effect is the same if the dependency has no backup.
Step 1: List the critical services and their targets
Start with the outputs of your business impact analysis: the critical activities, their maximum tolerable period of disruption and their recovery targets. If you have not set these, our explanation of RTO and RPO covers the terms. Single point of failure analysis should focus on the activities where a short outage causes serious harm. Trying to analyse every process produces too much detail to act on.
Step 2: Map dependencies for single point of failure analysis
For each critical activity, list what it needs to run. A useful checklist groups dependencies into five categories.
Category
Examples of dependencies
People
Named specialists, key decision makers, on-call staff
Technology
Applications, databases, servers, network links, power, cloud regions
Buildings, data centres, specialist equipment, workspace
Suppliers
Outsourced services, critical materials, telecom and utilities
Draw the dependencies as a simple diagram or table. For each item, note how many alternatives exist. An item with none is a candidate weak link. Dependencies of dependencies matter too: an application may sit on a replicated database but rely on one identity service.
Step 3: Identify the weak points
Ask three questions of every dependency. Is there only one? Is there more than one but they share a common cause of failure, such as the same building, power feed or supplier? Would recovery take longer than the tolerable period? The second question catches false redundancy. Two servers in the same rack do not protect against a rack failure, and two suppliers that rely on the same upstream provider may fail together.
Hidden single points of failure
Some of the most damaging weak points are not on any asset list. They include the one employee who knows how to run a legacy job, a shared password held in a single manager’s notebook, a domain registration with an expired card, a licence key nobody can find and a supplier’s account that only one person can log into. Interviews with the people who do the work are the best way to find these.
Involve the people who run the service day to day. Architects and managers know how a system is meant to work; operators know the workarounds, shortcuts and undocumented steps that keep it running. A short interview with each team, asking “what would you do if this disappeared tomorrow?”, often turns up a dependency that no diagram contains.
Step 4: Rate the risk from each single point of failure
Rate each weak point by the impact of loss, the likelihood of loss and the time to recover compared with your target. Use the same scales as the rest of your risk assessment so results can be combined. A weak point with a severe impact and a slow recovery deserves attention even if its likelihood looks low, because low-probability events happen and the cost of being unprepared is high. Record the inherent rating and the rating after any existing controls, and keep the reasoning in a sentence.
Supplier weak points need special care because you cannot inspect them directly. Our guide to supplier business continuity assessment explains what to ask suppliers about their own arrangements.
Step 5: Decide how to treat each weak point
There are four standard responses to a weak point.
Remove it. Add redundancy: a second link, a replicated database, a second supplier or a trained deputy.
Reduce it. Shorten recovery through better backups, spare equipment, documented procedures or pre-agreed arrangements.
Plan around it. Write a continuity plan step that covers the loss, including manual workarounds and communication.
Accept it. Where cost outweighs benefit, a named person accepts the risk for a stated period.
Cost matters. Not every weak point justifies full redundancy, so compare the cost of treatment with the cost of the outage and the effect on recovery targets. Treatment actions should have owners, dates and a way to verify that they worked, such as a test.
Testing the assumptions behind single point of failure analysis
An analysis is only as good as its assumptions. Redundancy that has never been tested may not work. Include failover tests, restore tests and tabletop exercises that deliberately remove one dependency and see what happens. Our guide to the business continuity exercise shows how to design these. Record the results and feed any surprises back into the analysis, because what an exercise reveals often differs from what the diagram promised.
A hypothetical example of single point of failure analysis
The following is a hypothetical example invented for illustration. A small online retailer identifies order fulfilment as a critical activity with a recovery target of four hours. The dependency map shows a warehouse management application hosted with one provider, a single internet link at the warehouse, one shipping-label service and one employee who can reconfigure the label printer integration.
The review finds three weak points. The internet link has no backup. The label service has no alternative, and the provider is a startup. The employee is the only person with the integration knowledge. The retailer adds a cellular backup link, contracts a second label provider on standby terms, and asks the employee to write a runbook and train a colleague. It tests the link failover in a short exercise, which reveals that the printer does not switch networks automatically, and fixes that too. The residual risks are recorded and reviewed quarterly.
Common mistakes in single point of failure analysis
Typical weaknesses include analysing only technology and ignoring people and suppliers, counting redundancy that shares a common cause, never testing failover, listing weak points without owners or dates, producing a huge map nobody reads, assuming suppliers have backups without asking, and treating the analysis as a one-off. Another is focusing on likelihood alone and dismissing a severe weak point as improbable.
Keeping single point of failure analysis current
Dependencies change constantly as teams adopt tools, suppliers change and staff move. Review the analysis when there is a significant change, such as a migration, a new supplier, a reorganisation or an incident, and at least once a year. Add a dependency check to your change management and procurement steps, so new weak points are caught at the time they are created. Store the results in your business continuity risk register so that they sit beside your other risks.
A structured report for single point of failure analysis
A consistent format lets you capture dependencies, ratings and treatments for every critical service in the same way. The Business Continuity Risk Assessment Report and Workbook provides a report and workbook for documenting continuity risks and their treatment. Whichever tool you use, keep the same structure across services so leaders can compare results and spot patterns.
Single point of failure analysis FAQ
What is a single point of failure?
Any single component, person, supplier or facility whose failure would stop a critical activity because no alternative exists or the alternatives share the same cause of failure.
Is single point of failure analysis required by ISO 22301?
The standard requires a risk assessment process for disruptive incidents. It does not name this technique, but the analysis is a practical way to meet that requirement for critical activities.
How is it different from a business impact analysis?
A business impact analysis shows which activities matter and how fast they must recover. The single point of failure analysis examines what those activities depend on and where one loss would stop them.
Do we have to remove every single point of failure?
No. Treat them according to risk and cost. Some can be reduced, planned around or accepted with senior approval and an expiry date.
How often should the analysis be updated?
At least annually and when a significant change happens, such as a system migration, a new supplier, a restructure or an incident.