CART
Free gap assessment
What does your CSF 2.0 Current Profile look like?
Score all 106 subcategories across the six functions, free, including the 31 under Govern that version 1.1 never asked about.
Run the free NIST CSF gap assessment → or View premium report sample
Searches for NIST CSF maturity levels are looking for something the Framework does not contain. CSF 2.0 has no maturity model. It has 106 outcomes, Organizational Profiles, and four Implementation Tiers that NIST presents as a notional illustration of how rigorously risk is governed and managed — explicitly not as levels of maturity.
That distinction between Tiers and NIST CSF maturity levels is not a technicality worth ignoring, because the two answer different questions and get used for different things. But it is also not a dead end: measuring maturity against the Framework is a legitimate and common thing to do, and this is how to do it without misrepresenting what CSF 2.0 says.
The four Tiers — Partial, Risk Informed, Repeatable and Adaptive — read like a maturity scale, and that is why they get used as one. Three differences matter:
| Implementation Tiers | A maturity scale | |
|---|---|---|
| What is measured | Rigour of risk governance and risk management, organisation-wide | Capability of a specific process or outcome |
| Granularity | Two scores for the whole programme | One score per outcome, so 106 of them |
| Direction | Chosen against risk appetite; Tier 4 is not the goal for everyone | Usually assumes higher is better |
| Use | Context for a Profile; a one-line summary for a board | Finding and prioritising specific gaps |
The granularity difference is the practical one. A Tier tells you the programme is Risk Informed. It does not tell you that your asset inventory is solid and your supplier assurance is not — and that is the information an improvement plan is built from. If you want to know where to spend next quarter’s budget, you need a score per outcome, which means a maturity assessment sitting alongside the Tiers rather than instead of them.
The other trap: the Tiers are scored on two axes, governance and management. Collapsing them into one number loses the most useful finding a Tier assessment produces, which is a programme strong on operations and empty on governance. Our guide to the NIST CSF Tiers covers that reading in full.
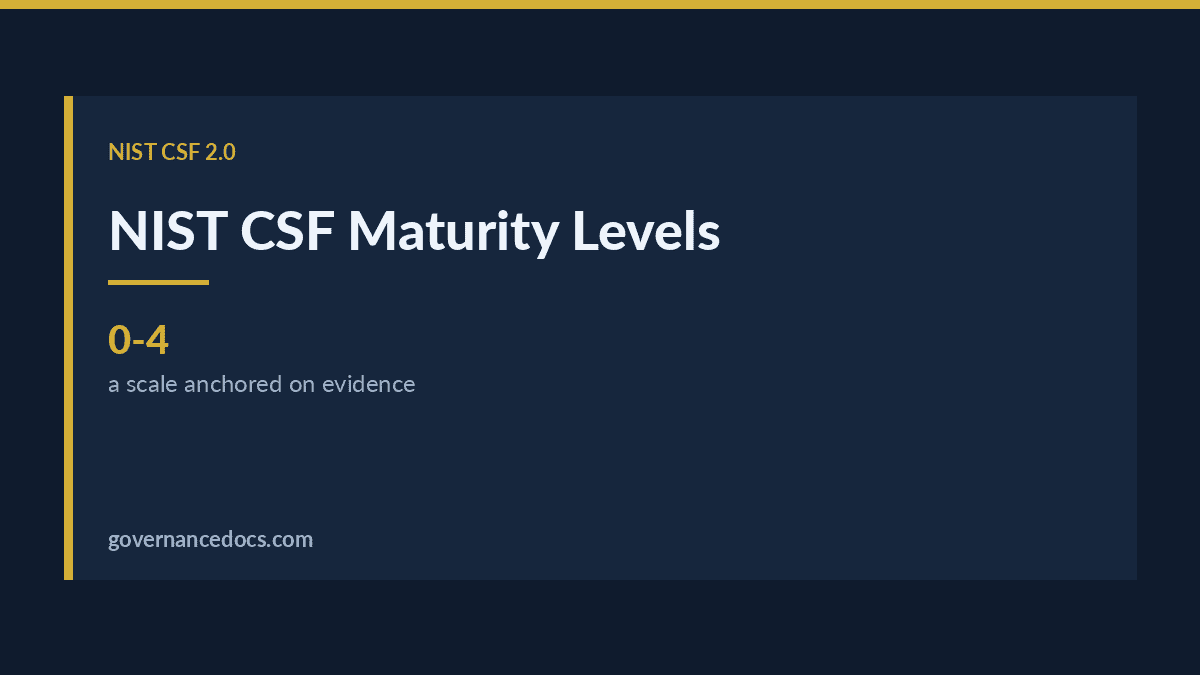
Since NIST does not publish one, you are choosing a scale. The usual mistake is choosing one with too many levels, which produces long arguments about whether something is a 3 or a 4 and no more useful an answer. Five points, anchored on evidence rather than sentiment, is enough:
| Score | Label | Test |
|---|---|---|
| 0 | Not performed | The outcome is not achieved in any form |
| 1 | Ad hoc | Happens sometimes, driven by individuals, no defined process, no reliable evidence |
| 2 | Defined | A defined process exists and is followed in most cases; evidence exists but is inconsistent |
| 3 | Managed | Consistently performed, evidenced and reviewed. A third party would accept the evidence |
| 4 | Optimising | As Managed, and measured and improved on the basis of that measurement |
The line that matters is between 2 and 3, and it is a single question: would someone outside your organisation accept the evidence? Everything below that line is something you believe about yourself. Everything on or above it is something you can show.
Score 4 deserves care. It requires measurement and demonstrable improvement driven by that measurement — not enthusiasm. If you cannot point at a change that was made because a metric moved, the outcome is a 3.
Whatever scale you adopt, NIST CSF maturity levels are only worth the evidence sitting behind each score.
The single biggest determinant of whether a maturity assessment is useful is what people are scoring against. Three rules keep it honest:
A fourth, less obvious rule: rate the outcome, not the tooling. Several CSF outcomes are satisfied by a decision written down rather than a product. GV.RM-02, the risk appetite and tolerance statement, needs no technology at all, and an organisation that scores it low because it has not bought anything has misread the outcome.
Free ISO 27001 risk assessment
Which of your risks sit above your appetite line?
Set your own risk criteria, pick from 61 information security risk scenarios, rate likelihood and impact, and decide how to treat each one. You get a heat map, a process score and the findings an auditor would raise, free.
Run the free risk assessment → or View premium report sample
Across the Core, some outcomes are consistently harder to evidence than others — not because they are difficult, but because they are easy to read past:
Six of the sixteen outcomes with no CSF 1.1 predecessor sit in GOVERN, which is why an organisation carrying an old assessment across tends to see its governance scores fall rather than hold.
An assessment of NIST CSF maturity levels that stops at a score is a report. Turning it into work takes three more columns and one decision:
| Column | Why |
|---|---|
| Current score | Where you are, with evidence |
| Target score | Set per outcome — not uniformly 3 or 4 |
| Gap | Calculated, so it cannot go stale when a score changes |
| Driver | The risk, obligation or objective that makes this outcome a target |
The decision is that not every outcome is a target. Deciding an outcome is not a target this year is a legitimate, documented risk decision. An unexamined “all of them at 4” is a worse answer than a reasoned subset, and it produces a plan nobody funds.
The driver column is what makes the plan survive a budget conversation. A gap with a regulatory deadline behind it and a gap with nothing behind it are not the same gap, however similar the scores look.
Roll-ups by Function and Category are the right level for a board: six Function averages and 22 Category averages, with movement since the last cycle. Two cautions.
First, an average across a Function hides its shape. GOVERN has 31 outcomes; an average of 2.4 could be a flat 2.4 or a mix of 4s and 0s, and those need completely different responses. Report the count below the evidence line — how many outcomes score under 3 — alongside the average.
Second, never present a maturity score as an assurance claim. There is no certification against the CSF, no accreditation body, and no auditor who can issue one. A maturity score is your own measurement against your own scale. It is genuinely useful internally and to a customer who asks how you measure yourself, and it is not a compliance status.
No. CSF 2.0 defines Functions, Categories, Subcategories, Organizational Profiles and four Implementation Tiers. It contains no maturity model and no scoring scale. Any maturity scale you use is one you have chosen, and it should say so on its face.
Not usefully. The Tiers give two scores for the whole programme; a maturity assessment gives one per outcome. Use both: the Tiers for context and board-level reporting, a per-outcome scale for finding and prioritising gaps. Using the Tiers alone leaves you unable to say what to fix.
It varies by outcome, and setting one number for all 106 is a reliable way to produce a plan nobody delivers. Set the target from the driver — the risk, obligation or objective behind that outcome. Some will justify 4; many will sit at 2 or 3 permanently, and that is a decision rather than a failure.
Annually for a full re-baseline, with the action plan reviewed quarterly. Reassess sooner after a significant incident, an acquisition, or a change in regulatory obligation. Keep prior baselines — movement over time is the most useful thing the assessment produces, and overwriting the file loses it.
The people who operate the outcome supply the evidence; someone independent of them moderates. Self-scoring without moderation drifts optimistic, not through dishonesty but because everyone rates their own work against what they intended. Internal audit testing a sample of “achieved” ratings is the cheapest correction available. Our NIST CSF audit checklist guide covers how to run that test.
Read the Framework before you build any scale on it — it is free at nist.gov/cyberframework, and our NIST Cybersecurity Framework overview covers how the Core, Profiles and Tiers fit together.
Our NIST CSF Toolkit ships a scored assessment and maturity tool carrying all 106 Subcategories with NIST’s outcome text, the five-point scale above, an evidence reference against every score, a target and a calculated gap, and automatic roll-ups by Function and Category. Alongside it: Current and Target Profile workbooks, a gap analysis, a dated action plan, and a two-axis Tier self-assessment — 164 editable documents in total, with the 118 policies and procedures that turn a low score into a closed one.

October 23, 2026

October 22, 2026
October 22, 2026
October 22, 2026
October 22, 2026

